This is a series of drawings that were made with COLMAP photogrammetry software and a grasshopper script. First, I take a video of a space as I walk through it. The video is usually 1 or 2 minutes long.
I take the video into Photoshop, and convert it into several still images using the Export > Render Video > Photoshop Image sequence tool.
I use COLMAP, a Structure from Motion pipeline to build a point cloud of the space from the image sequence.
I use a grasshopper script to export the point cloud from COLMAP file formats into Rhino.
Another script is used to connect the points in the point cloud depending on their proximity to each other. I export images of these meshes with varying density back into Photoshop and blend them.
Sometimes I use the real color of the scene, or exaggerate certain color families.
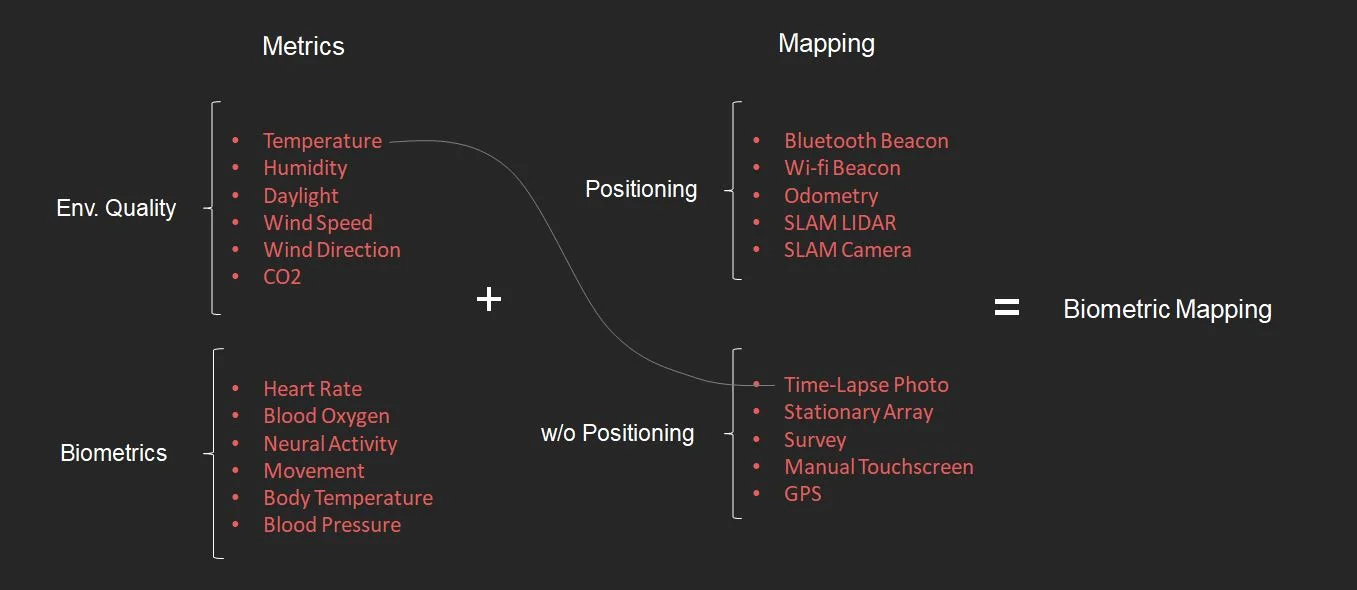
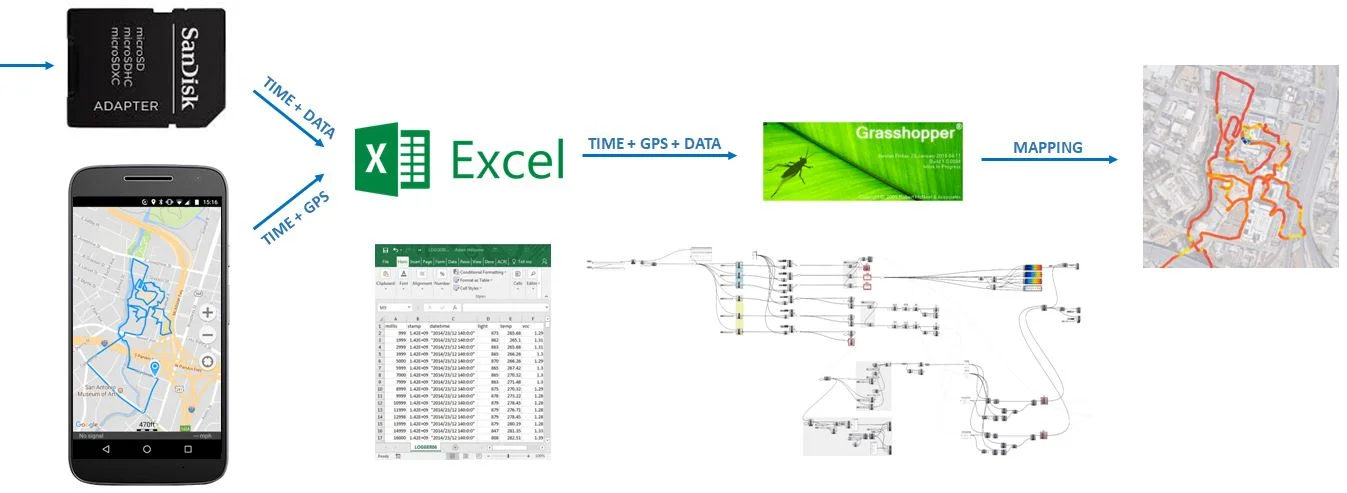
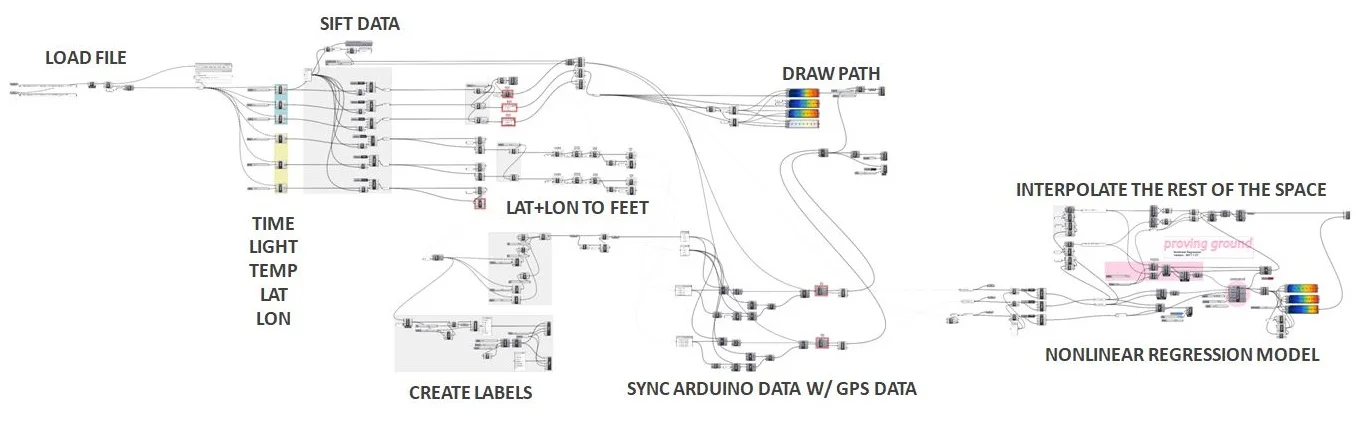
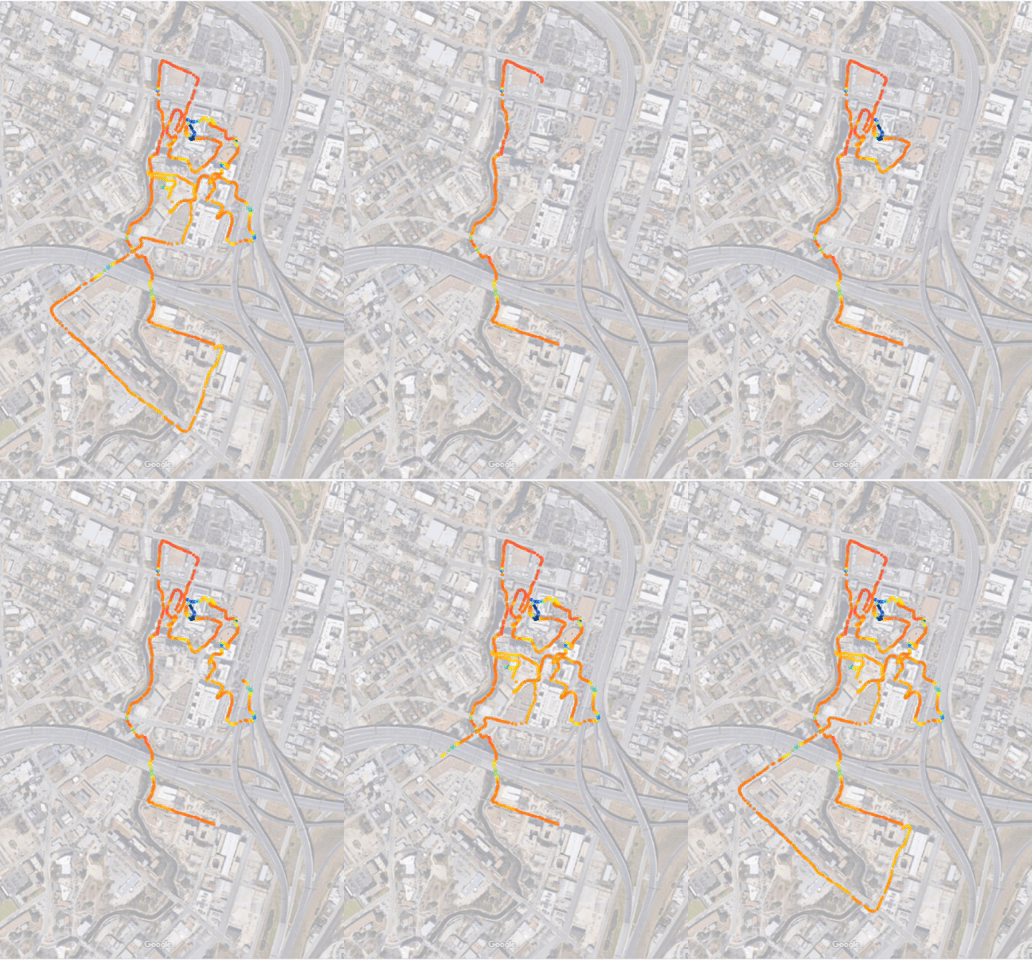
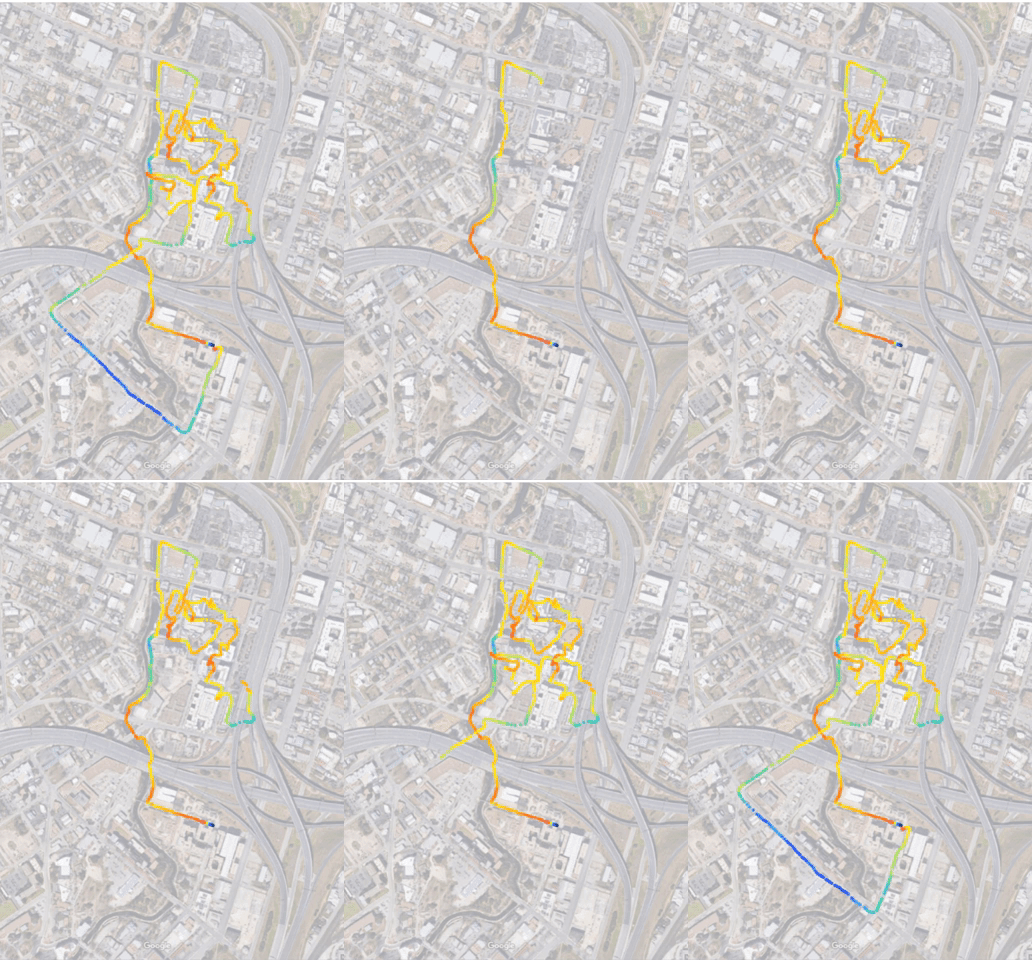
Read MoreBiometric Mapping is a workflow that creates heat maps of the unseen qualities of spaces. For example: air quality data such as CO2, temperature, and humidity, or biometric data such as an occupant's heart rate, blood oxygen level, and neural activity.
Read MoreThis is an experiment in generating graphics that look like artificial written languages.
A typical way of constructing a written language is to start with a one-to-one transposition of existing letters into invented letters. This bottom-up approach may or may not produce cohesive looking text down the line when the characters are joined. Instead of starting with an alphabet, this alternate approach begins with a few rules for the composition of the characters, and then introduces random variations of those elements until the text as a whole looks convincing. From here, natural occurring and compelling fragments can be assigned to actual letters, and the alphabet can be post-rationalized.
Read MoreThese metrics are usually collected manually, either at an early site visit, or as a post-occupancy evaluation of a built project. It usually involves printing a gridded plan of a building and walking through with a daylight meter, thermometer, or anemometer and taking readings every few feet while marking it on a clipboard. This is cumbersome and it takes a long time to map a large space.
Read MoreThese radial calendars show the energy-use patterns of six Lake Flato projects in 2016. The hourly data we collect from our energy monitors can be plotted into a single graphic with a Grasshopper script and reviewed to understand energy patterns and anomalies that wouldn’t be apparent through numerical data alone.
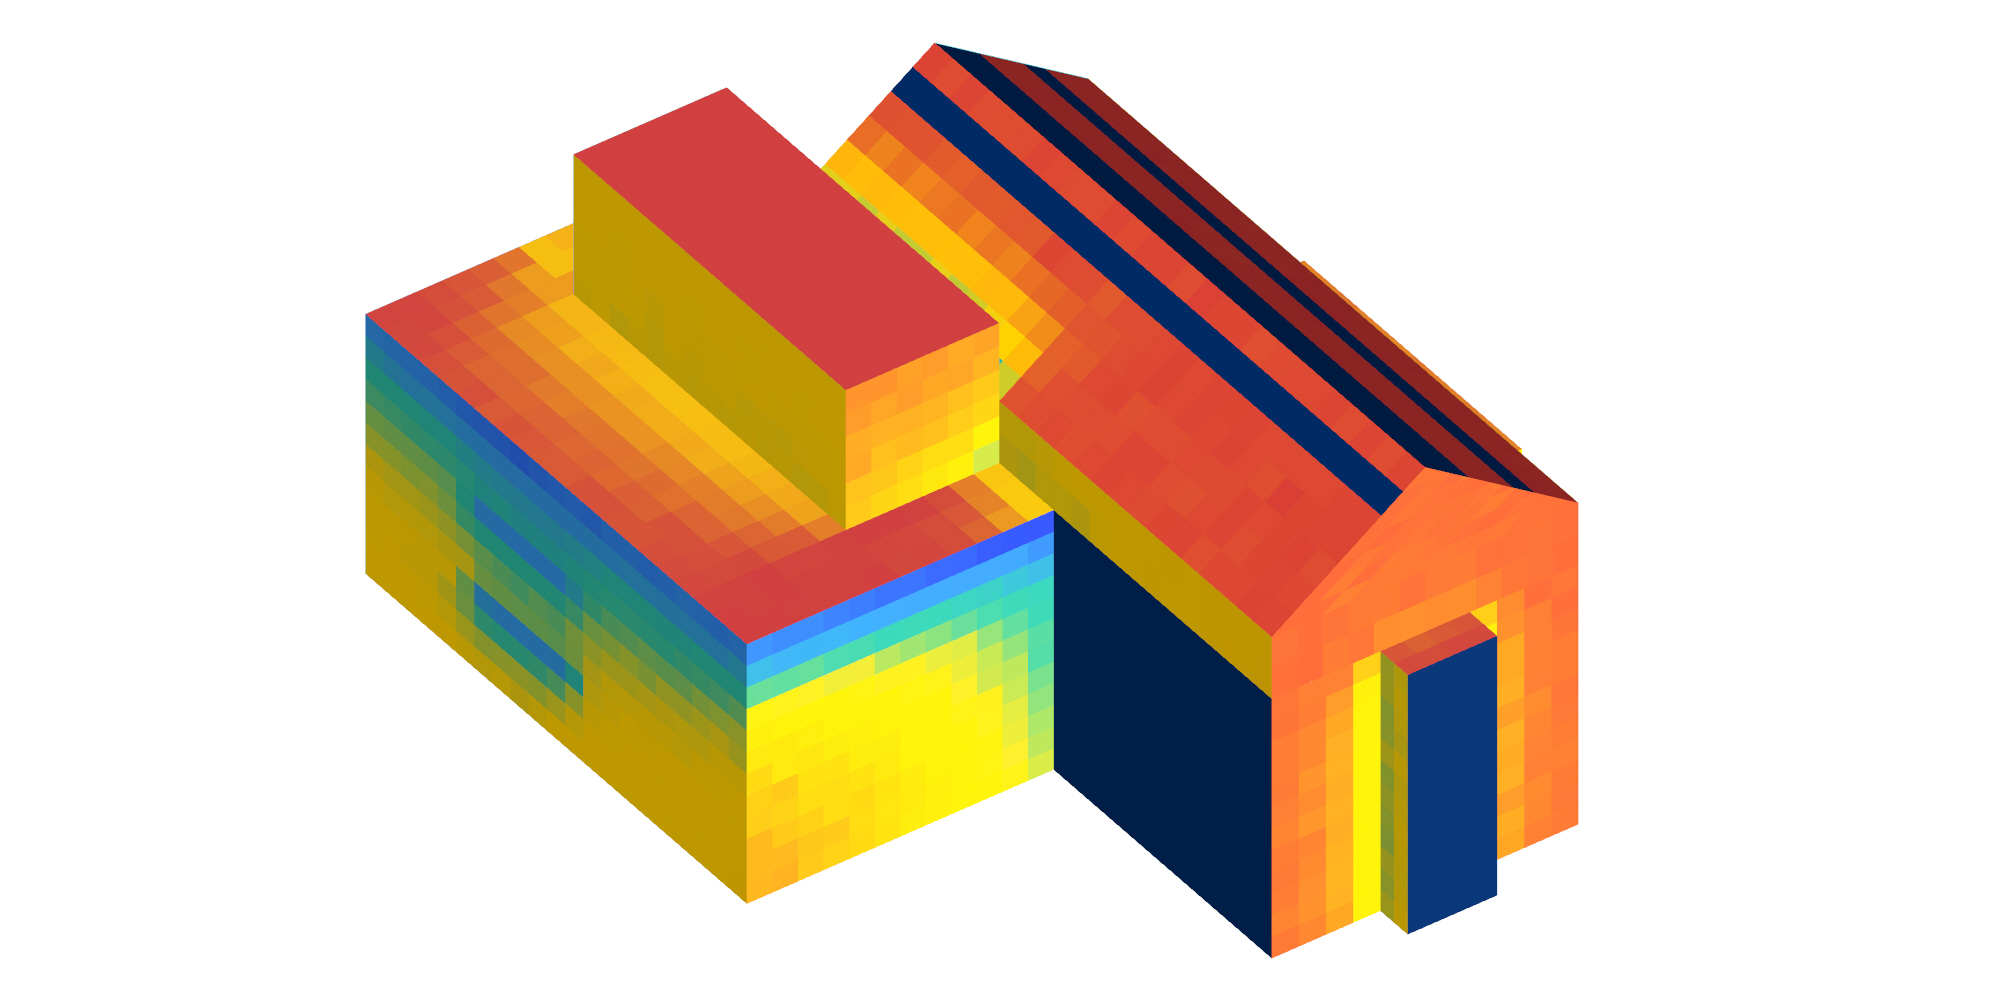
Read MoreArchitects have always had to deal with the challenges of solar energy, whether providing protection from it, or leveraging it for energy and daylight. Like many other challenges, we have a habit of throwing brute force technology at it to solve the problem at hand. Building technologies of the past were simple and utilitarian by necessity, and today, we are finally returning to the simplicity of the past with elegant, biomemetic solutions.
Lake Flato recently established a research and development program with the goal of providing a framework to promote innovative thinking that supports our vision to be leaders in the integration of design and sustainability. This is the first in a series of posts documenting the initial round of research projects in the Fall of 2016. My challenge was this: to develop a system that rotates to face the sun throughout the day using nothing but solar heat energy from the sun itself, and no technical equipment.
Considerations included preventing unwanted heat gain, and maximizing usable daylight while maintaining views straight out of the window. And finally, it had to be made with affordable and easily available materials. If I couldn’t make it with cheap bulk materials from Home Depot, and put together in the Lake Flato Shop, then the technology isn’t simple and affordable enough to be ubiquitous and scalable.
Read MoreFor the second straight year, I've recorded my activities in six categories: Daily, Health, Music, Social, Work, and Education (each represented by a different color in the graph above). I started this for the purpose of self-accountability during grad school, when there just aren't enough hours in the day. This data lives in a giant Excel spreadsheet that I update daily.
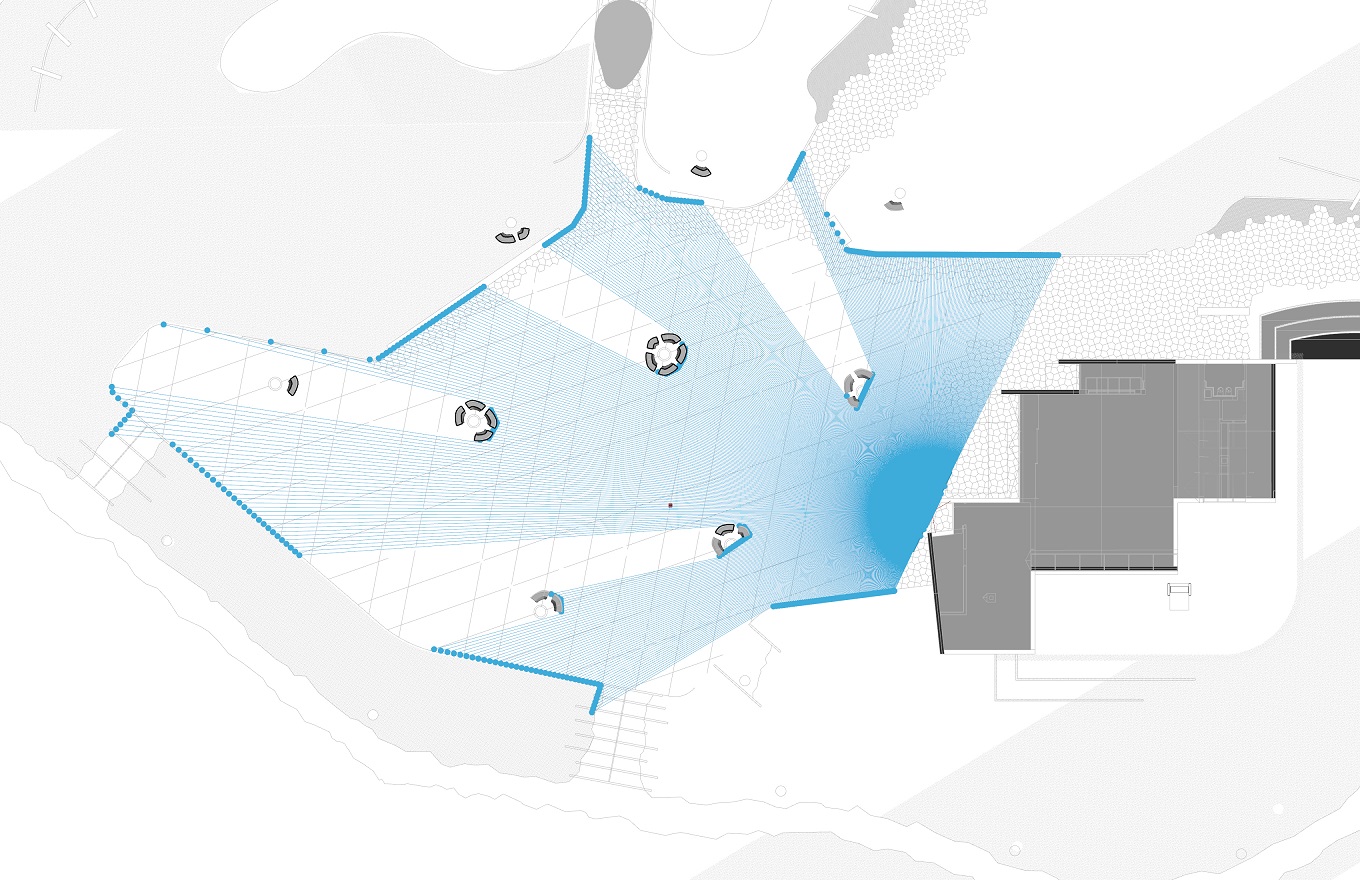
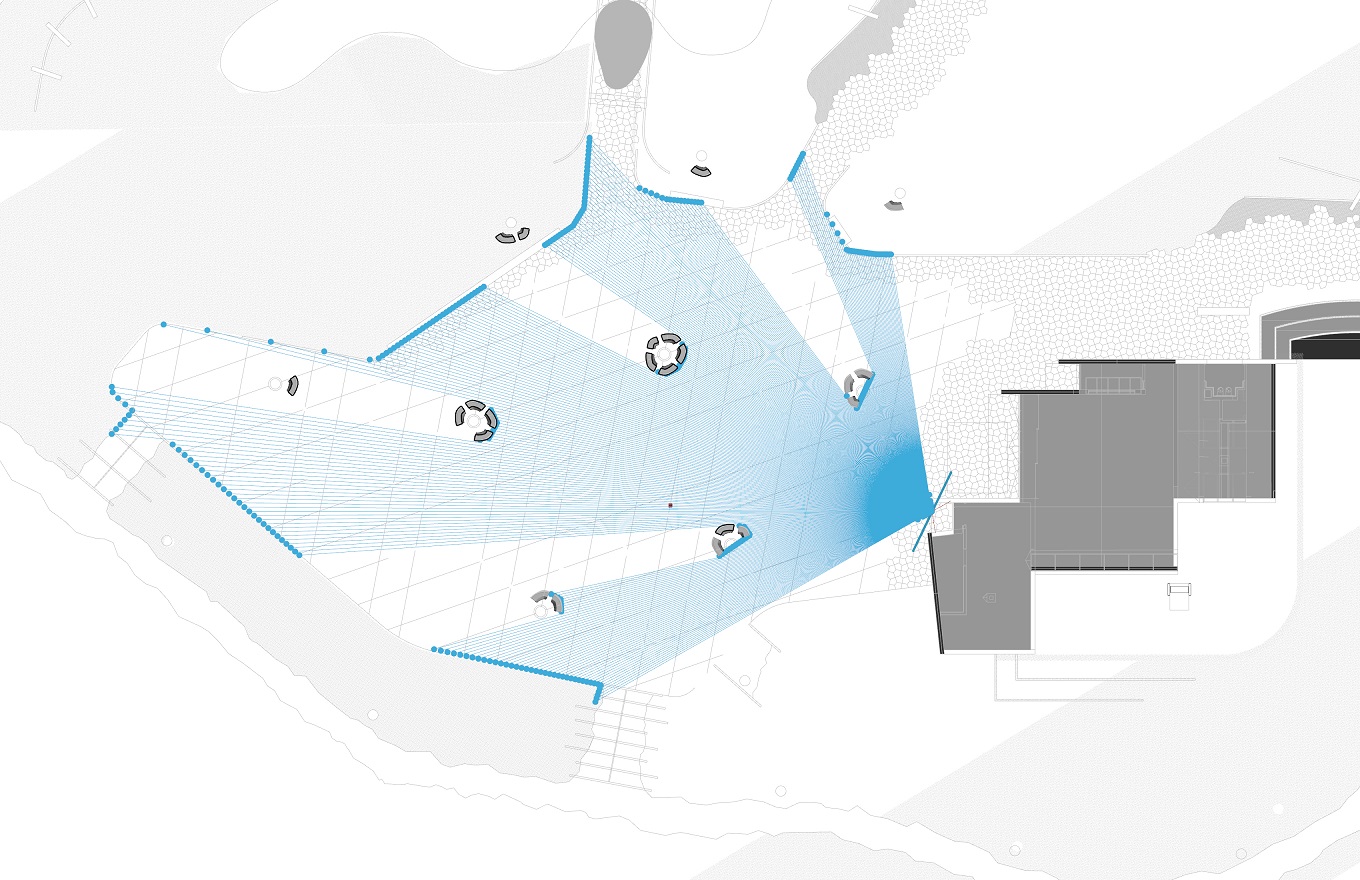
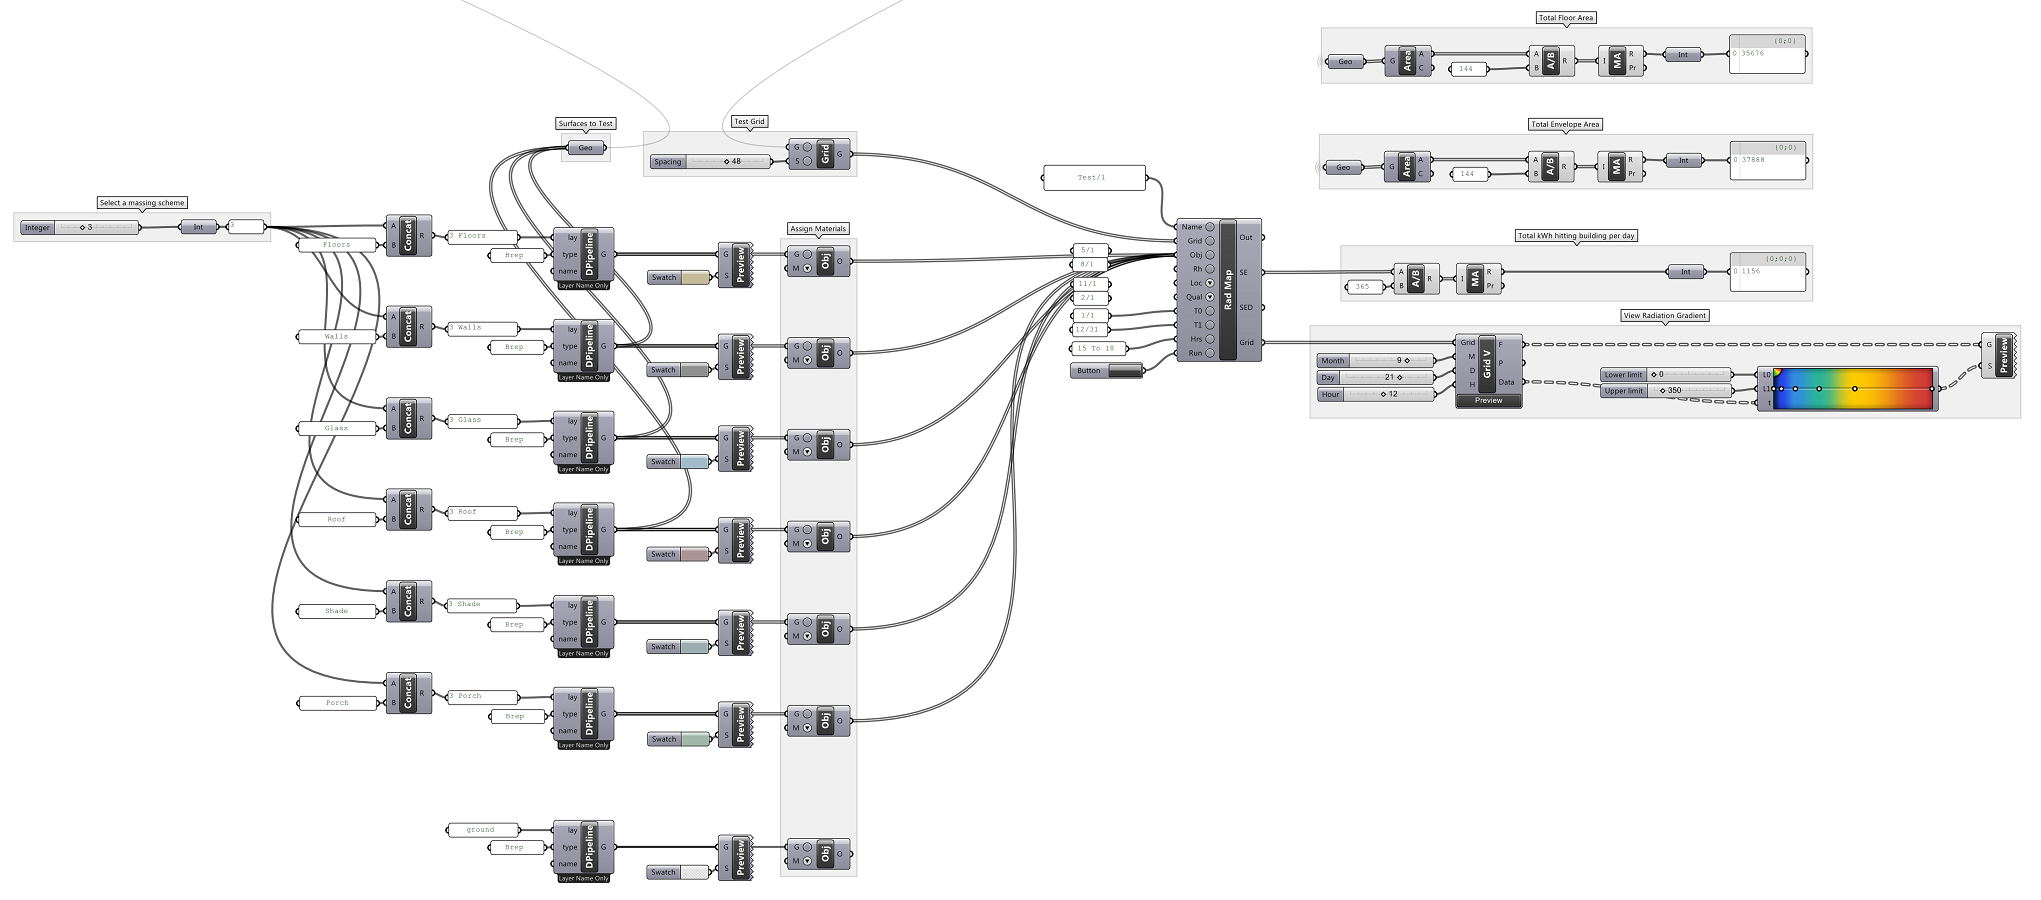
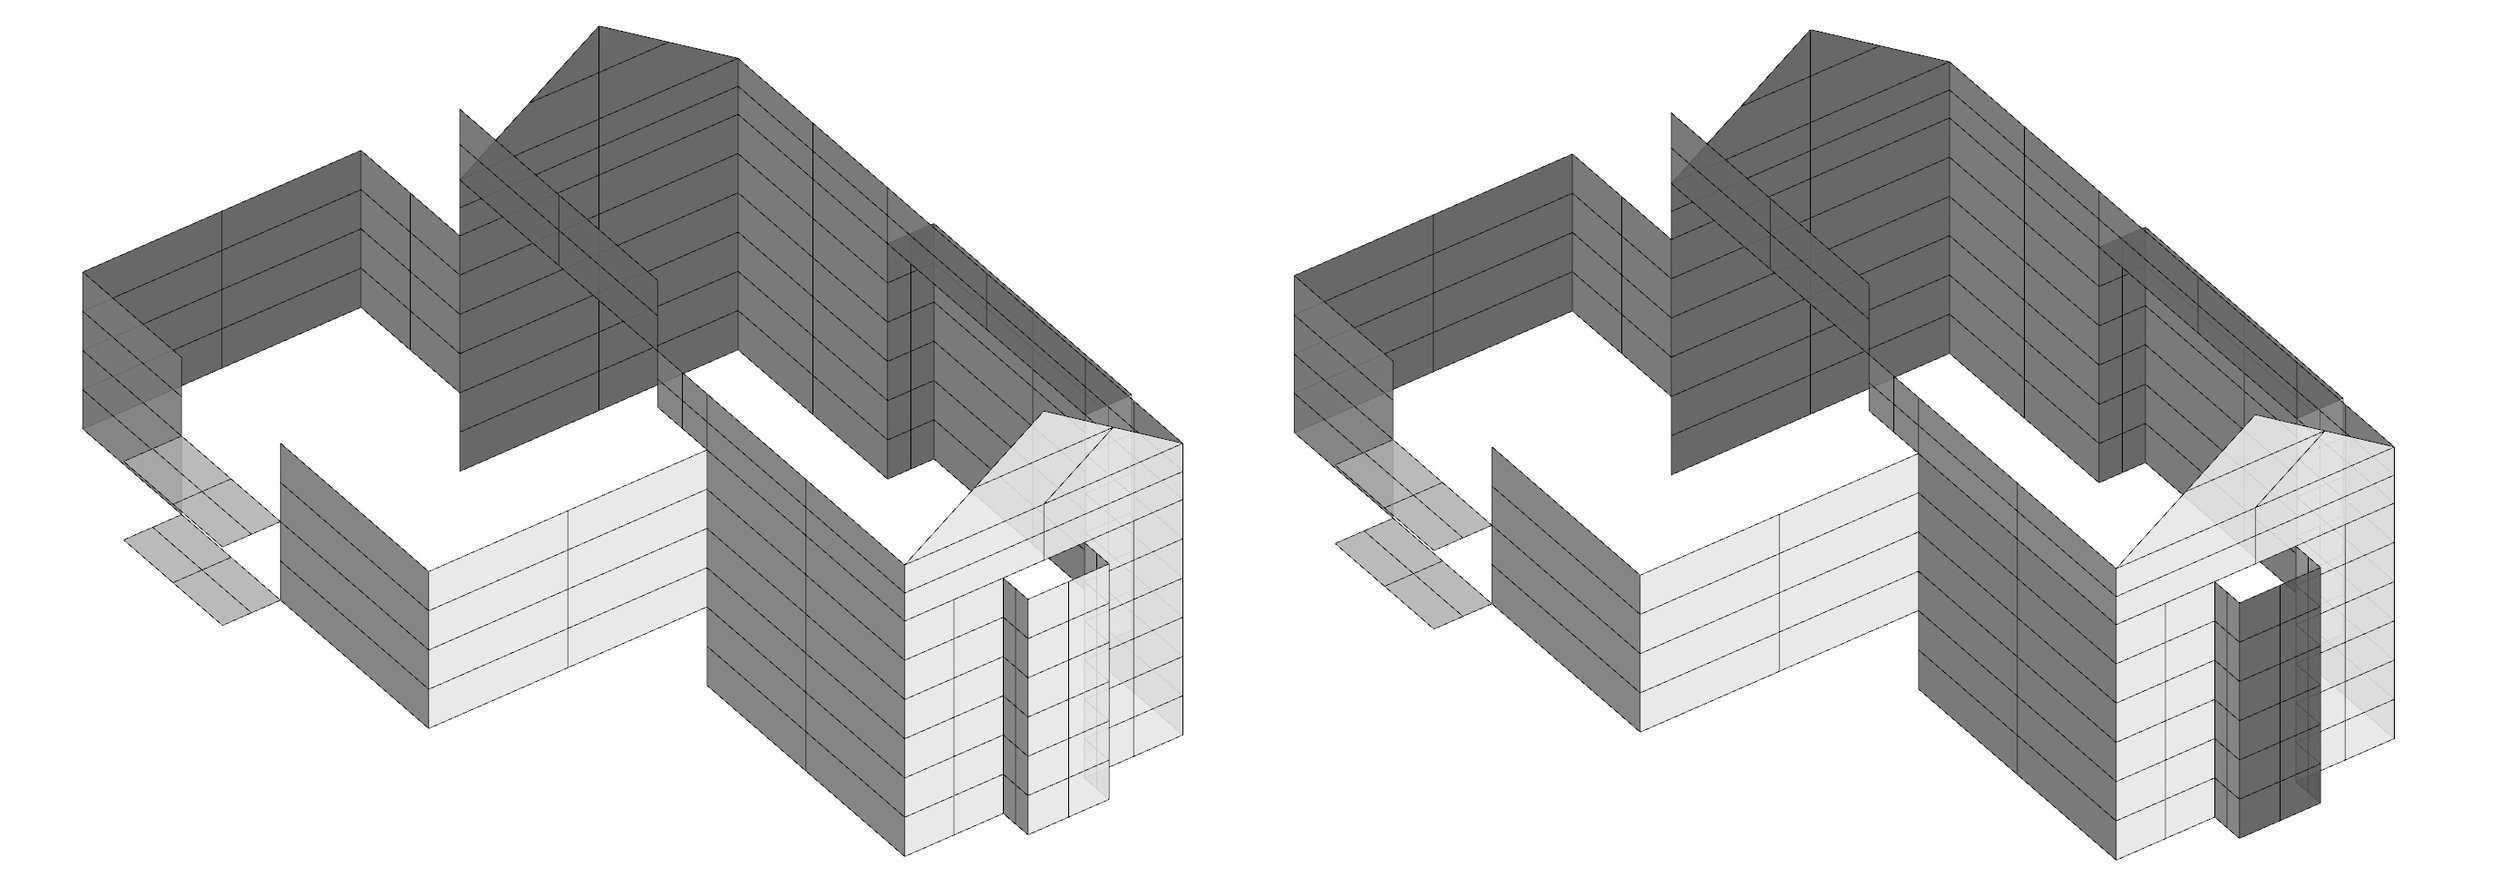
Read MoreManually calculating outside views for the LEED IQEc8.2 credit is a tedious exercise. Here are three attempts at automating the LEED views calculation through Grasshopper. More importantly, this is an attempt to measure high quality views, rather than using the pass/fail criteria used for LEED.
Read MoreFor the last 24 months I've recorded my activities in six categories: Daily, Health, Music, Social, Work, and Education (each represented by a different color in the graph below). I started this for the purpose of self-accountability during grad school, when there just aren't enough hours in the day. This lives in a giant Excel spreadsheet that I update daily.
The following is a snapshot of 2015. More thorough analysis to come.
Read More