This is a scoring system for running performance, across distance and age.
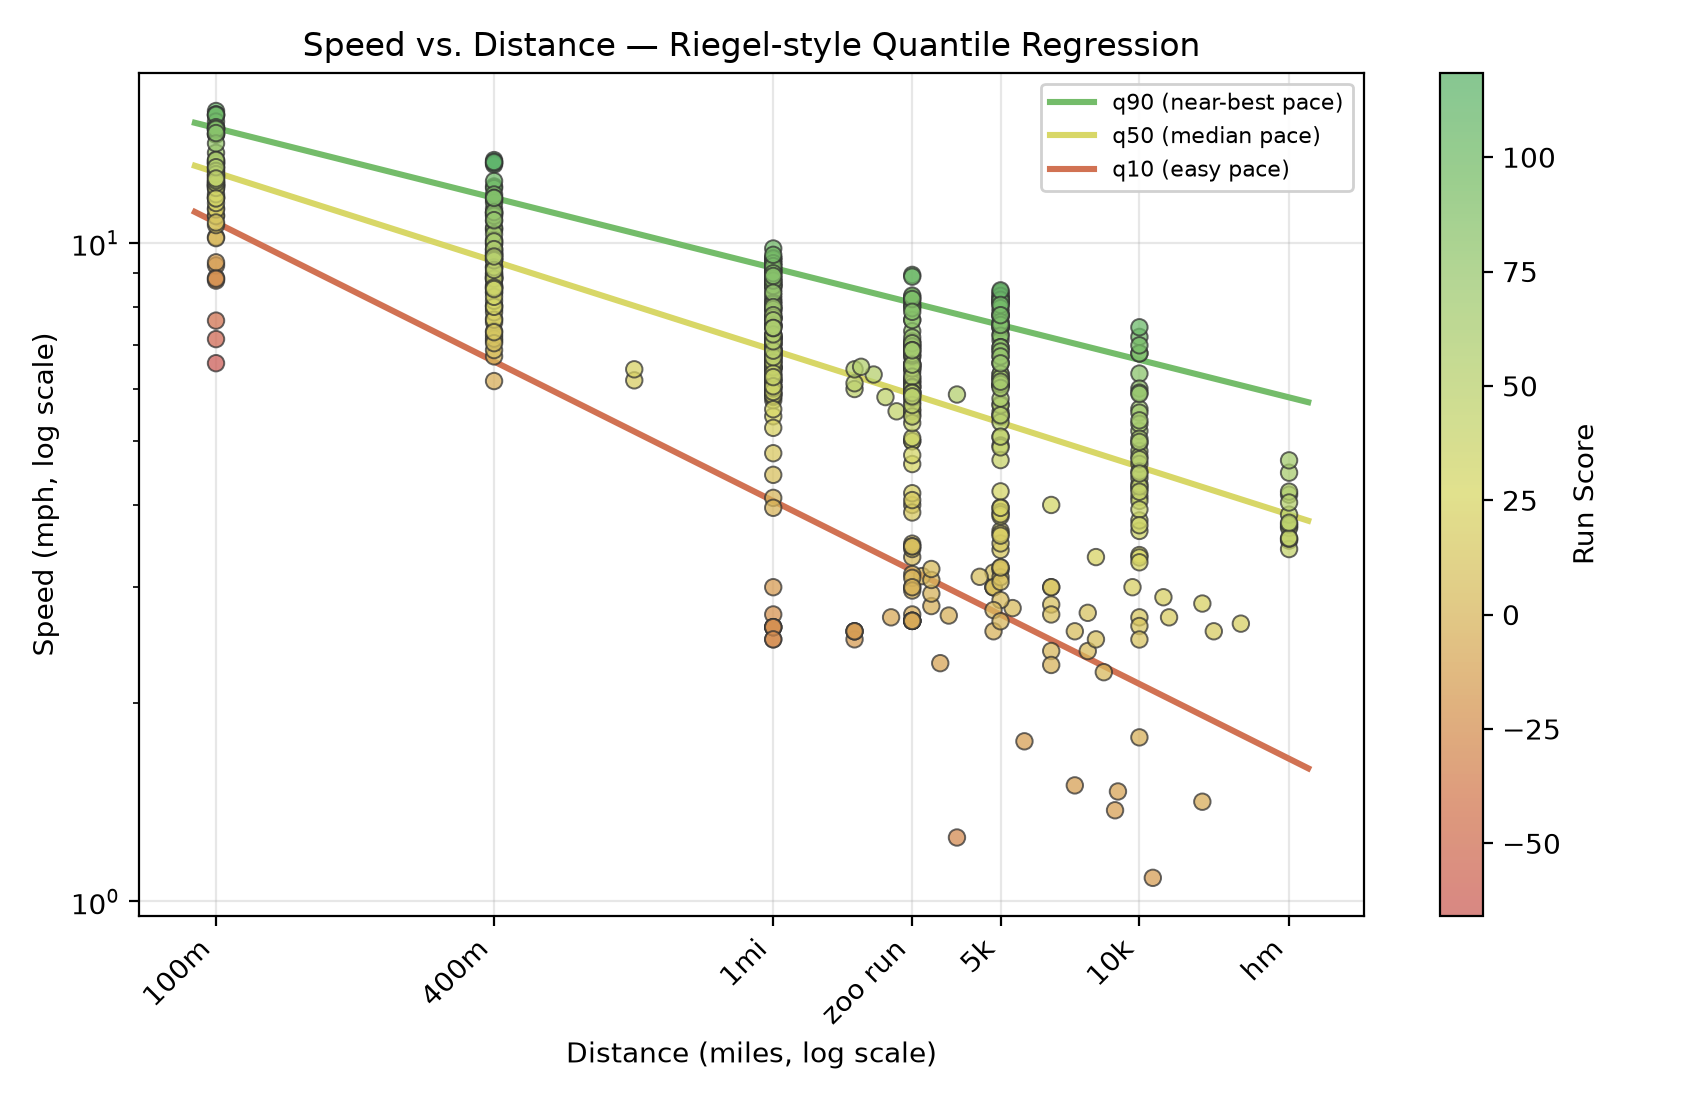
First, a plot of running speed over distance. Each dot is one run. Both axes are fit to a log scale, because speed drops off as a power law of distance, similar to Riegel's classic race-time prediction formula. Quantile regression fits a straight line through the 90th, 50th, and 10th percentiles. This is the structure for scoring runs in terms of performance across any distance.
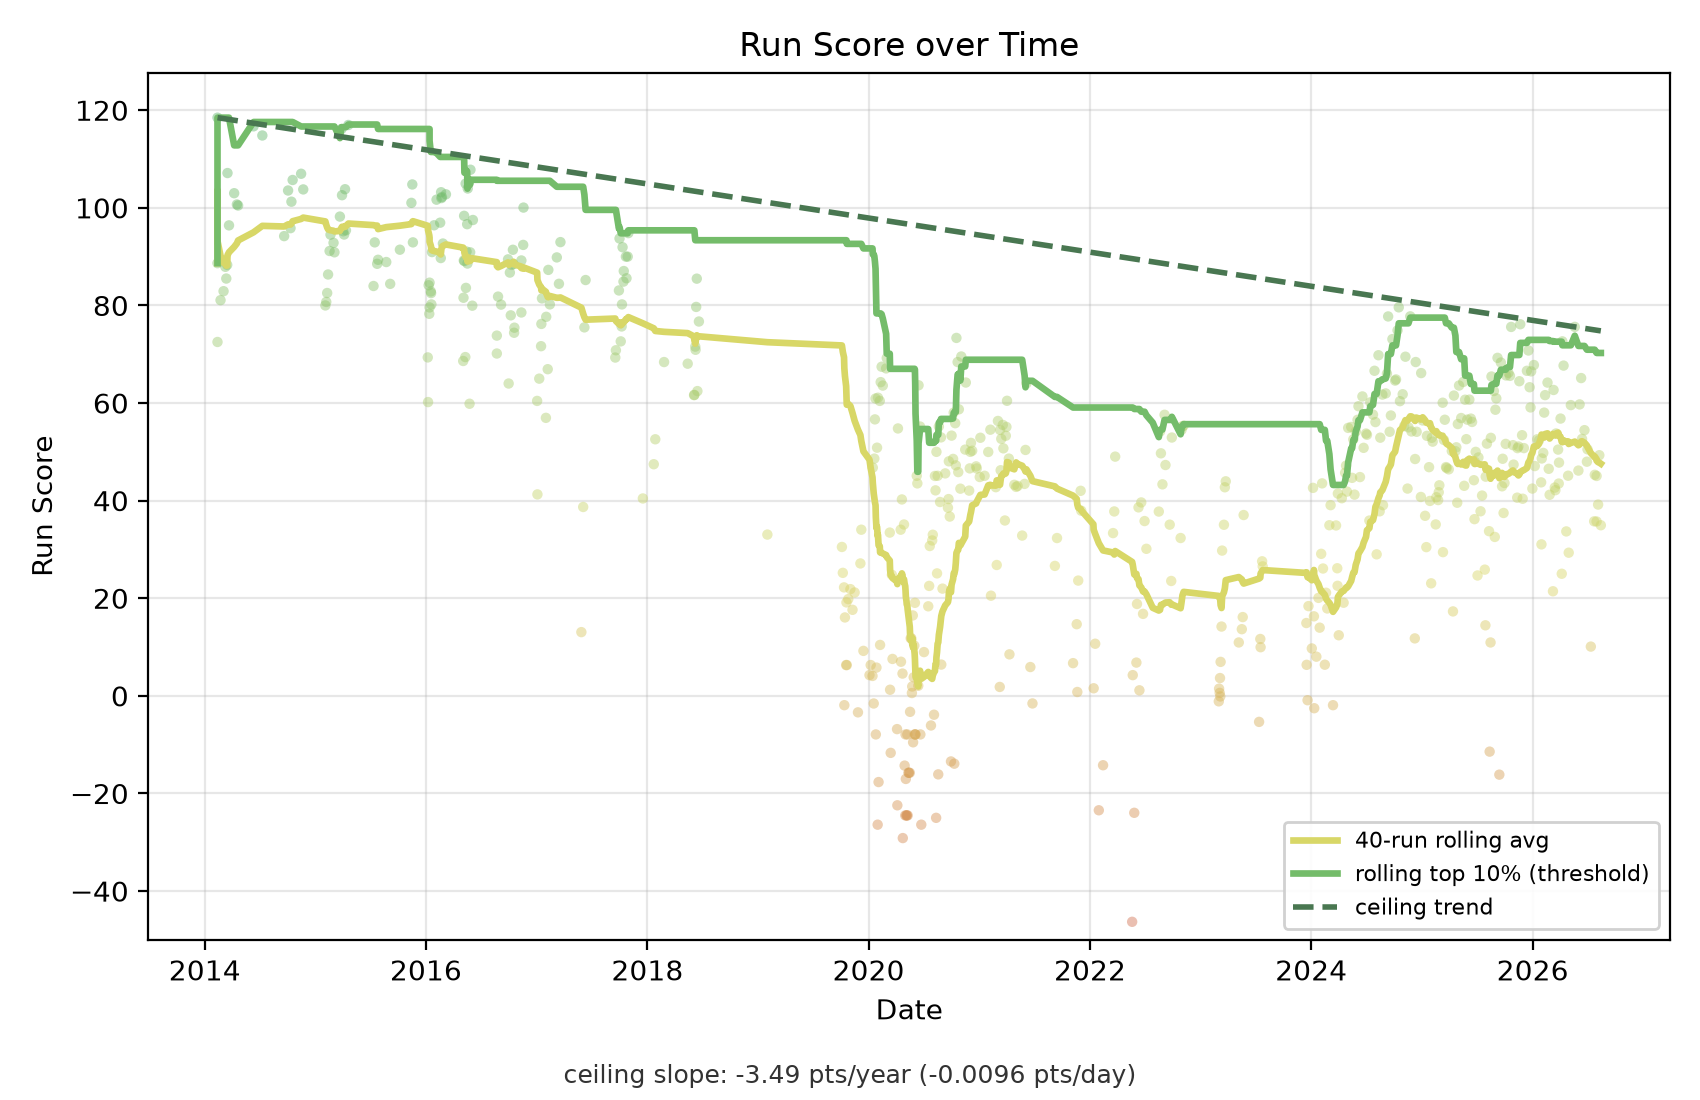
Hey, look, I’m getting slower.
A ‘ceiling’ trend line is fit from the highest scores in my first year of data to the highest score in my most recent year of data.
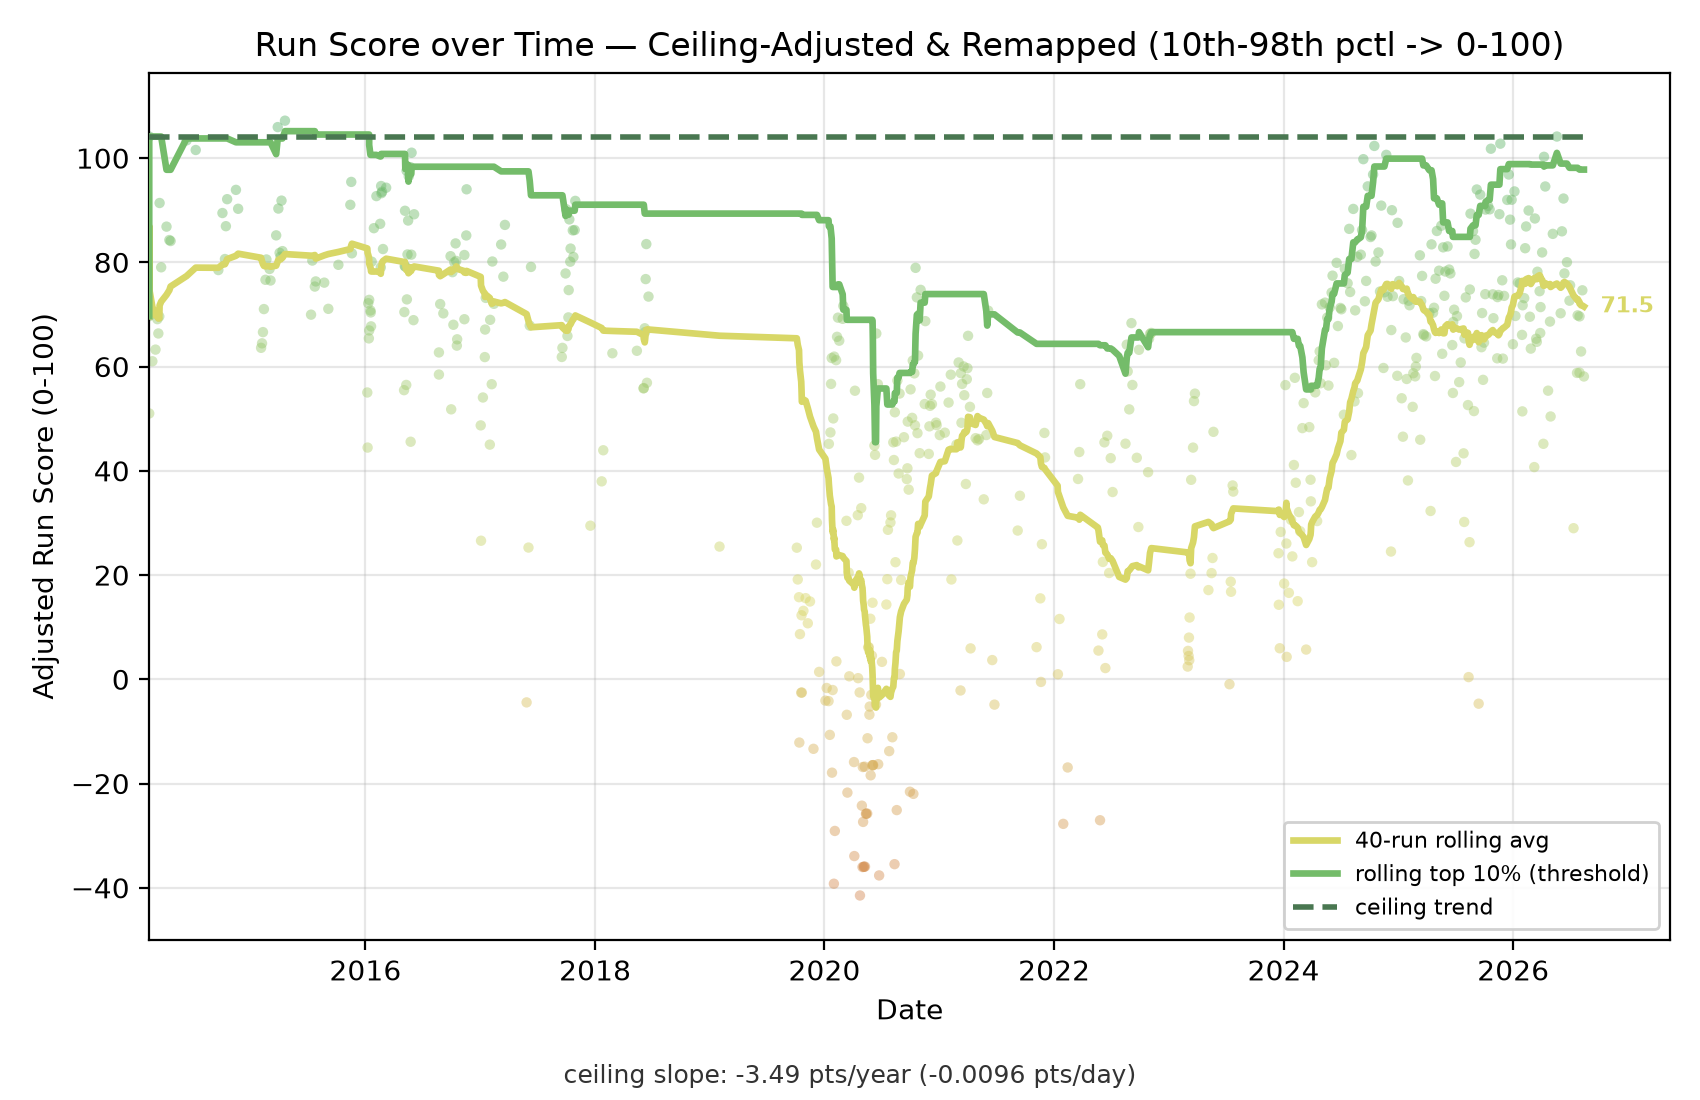
The ceiling slope is subtracted, resulting in an age-adjusted performance score. Scores are remapped slightly so most scores fit between a more intuitive 0-100 scale, with a few outliers. This is a bit more motivational to aim for high scores on an adjustable scale, rather than being constantly short of PRs from 12 years ago, and wondering what my relative effort is. Also motivating to hit a new recent high, which causes a whole re-adjustment to the scoring.