• Projects
  • New Things
  • Drawings
  • Instagram
  • About
Menu

Adam Heisserer

  • Projects
  • New Things
  • Drawings
  • Instagram
  • About

Life Graphs: 2016

January 9, 2017

For the second straight year, I've recorded my activities in six categories: Daily, Health, Music, Social, Work, and Education (each represented by a different color in the graph above). I started this for the purpose of self-accountability during grad school, when there just aren't enough hours in the day. This data lives in a giant Excel spreadsheet that I update daily.

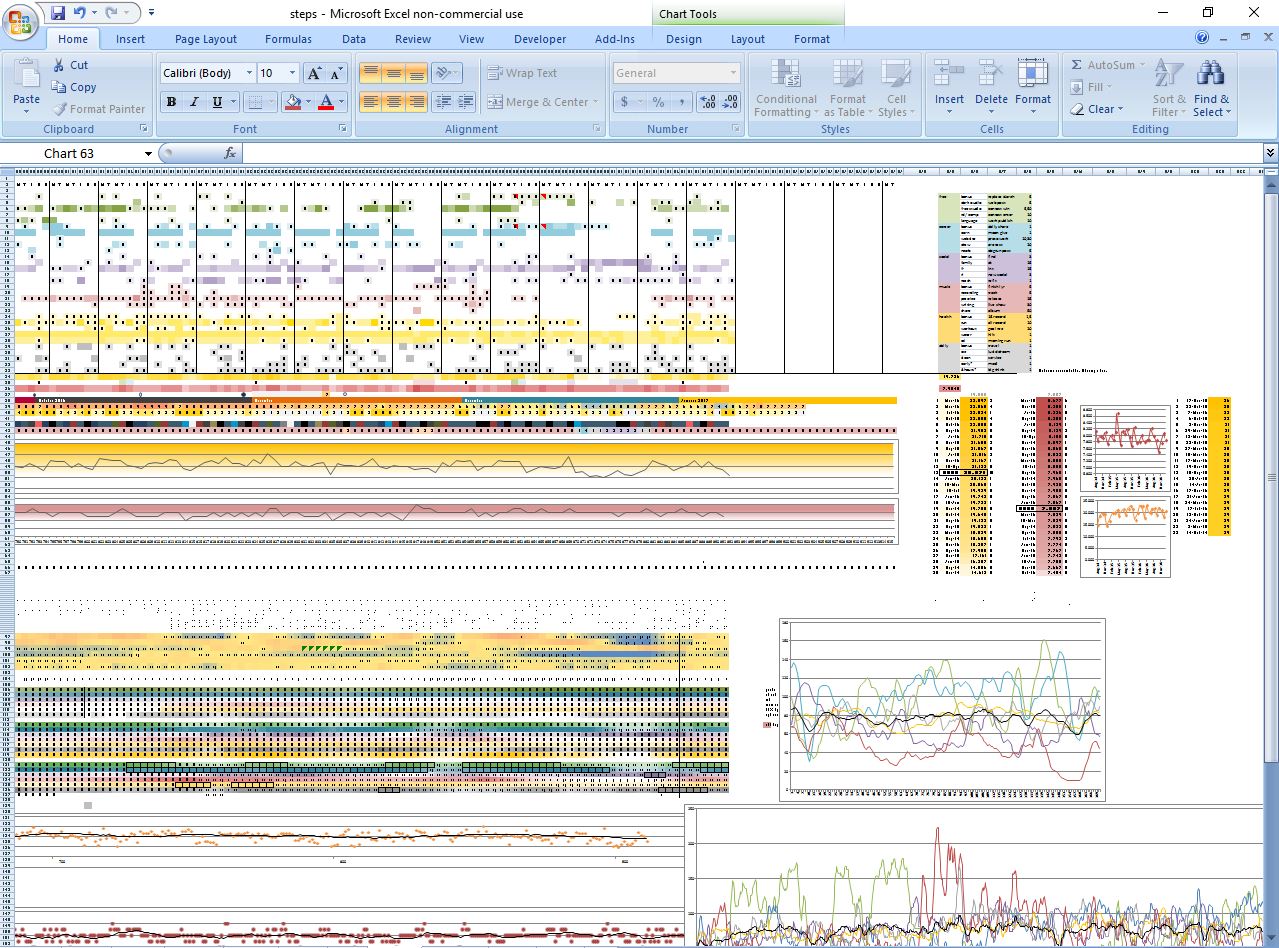
A view of the giant Excel spreadsheet I update daily

2015 vs 2016

2015 vs 2016

Correlations to Productivity

Correlations to Productivity

Correlations to Happiness

Correlations to Happiness

← Passive Solar TrackingKinetic Bus Shelter →

Latest

New Things
A dimensional model of emotion based on Principal Component Analysis
about a month ago
Co-Authorship with AI
about a year ago
Graphing Multiple Moving Averages with Python
about 2 years ago
Image to Image Translation with Stable Diffusion
about 2 years ago
StyleGAN2 + CLIP Guided Diffusion
about 3 years ago
Music Blocks
Music Blocks
about 3 years ago
Analyzing Architectural Drawings with Hough Transform
about 4 years ago
Using a Rhino Environment to Train a Surface-Normal Prediction Model in Pix2PixHD
about 4 years ago
StyleGAN "Notebook"
StyleGAN "Notebook"
about 4 years ago
Play Pavilion at Margaret Hance Park
about 4 years ago
Moving Average - Grasshopper Component
about 4 years ago
5 Years of Shirts
5 Years of Shirts
about 4 years ago
Pseudo Non-Linear Regression in Grasshopper
about 4 years ago
City Roses - Graphic Tool for Visualizing Emotions
about 4 years ago
Data-Driven Classification of Feelings
about 4 years ago
Automated Climate Graphics with Grasshopper
about 4 years ago
Optimization Algorithms (Opossum) for Daylight Modeling
about 5 years ago
Mobile Meshes - Drawing with Photogrammetry
about 5 years ago
Biometric Mapping III
about 7 years ago
Constructed Language in Grasshopper
about 7 years ago


Powered by Squarespace