What is this? This is a Principal Component Analysis of my own emotional/affect data that I’ve recorded daily since 2017. This is an update with the latest data and new analysis.
What is PCA? A PCA takes a large number of features, in this case, 61 emotional states, and reduces the data into a smaller set of components. The original feature set has a lot of highly correlated movement, so interpreting all 61 emotional states is redundant. After PCA, I have a short list of PCs that succinctly describe my emotional states, in order of the most relevant and impactful.
P-technique. This is a P-technique study in that it’s studying one person’s data over a long time (a longitudinal study), as opposed to an R-technique study, where you would study several people over a single time frame.
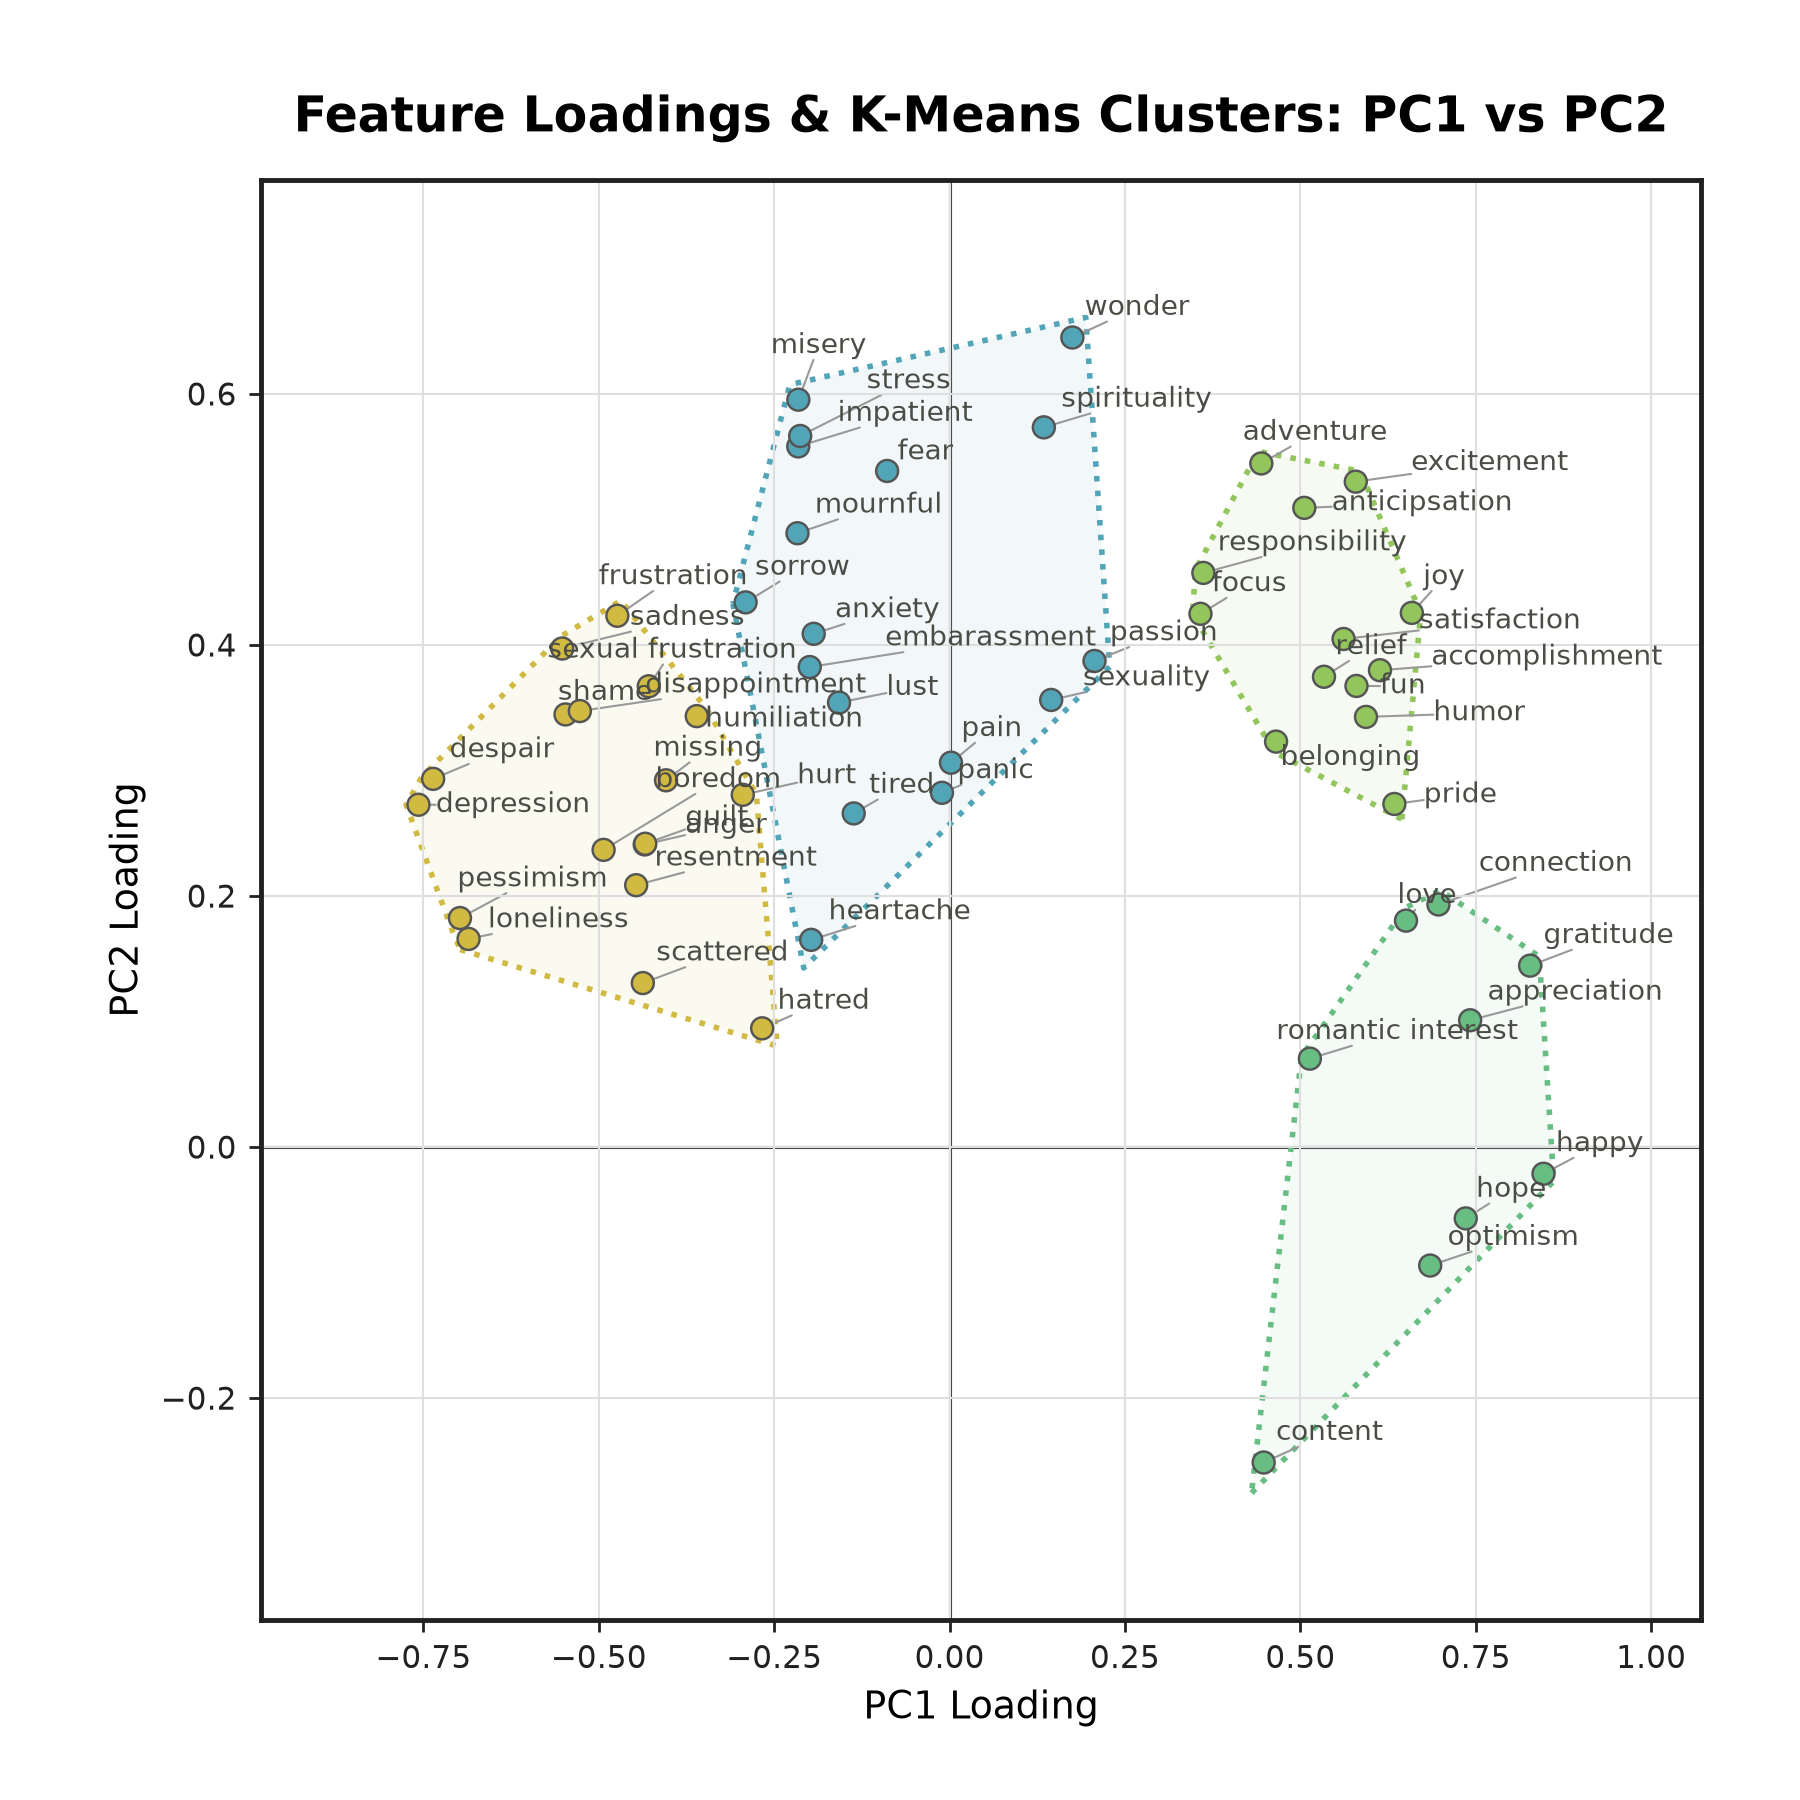
It’s not actually 61 features. My original data set has 61 states that I log, but I’ve removed a few that I deemed to be more ‘targets’ than ‘features’. These are: insomnia, drunk, sick, and jealousy. Think of features and targets as being independent and dependent variables, respectively. Physical states affect emotion state, not so much vice versa. These features got removed because they’re more of a result of decision-making or circumstance than affect. I should, in later studies, remove ‘pain’ and ‘tired’ on the same grounds. Also, the data suggests ‘panic’ is far more of a physical state than an emotional one, as it shows up with the other physically-driven features in the soft middle of the PC1/2 space. Jealousy was very underrepresented in my data set, so it was causing more noise than signal the few times it popped up.
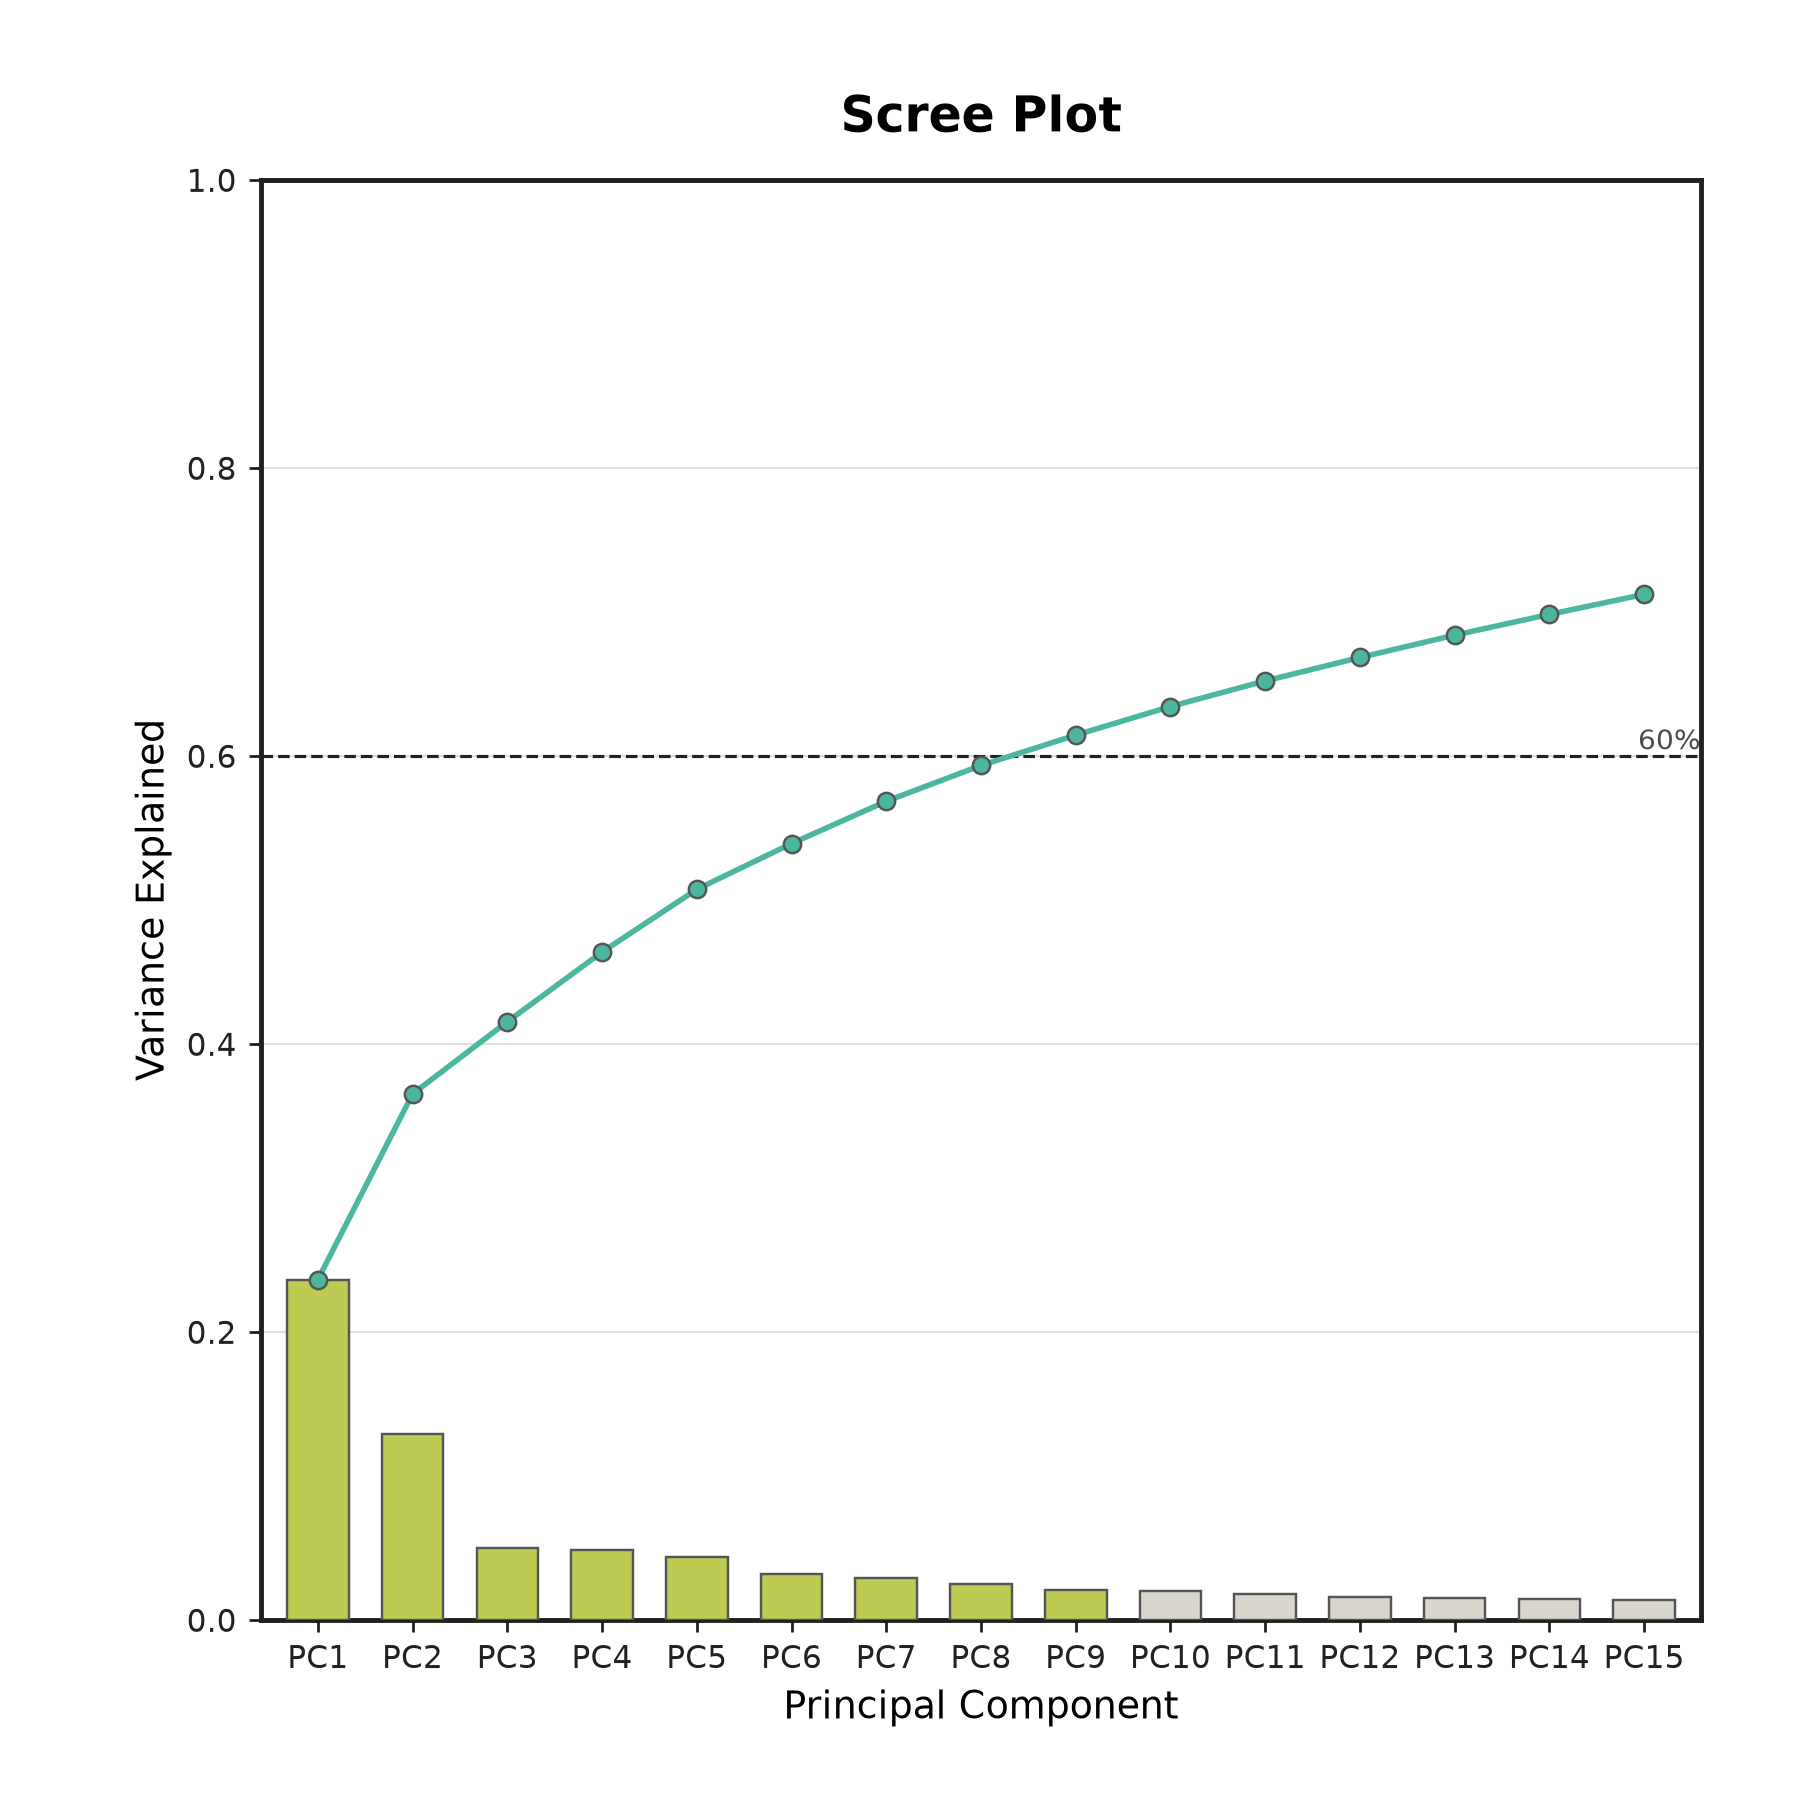
Process. Filled in a few blanks with regression/MICE-style imputation. Standardized everything into z-scores. It’s not about the raw value, but the relative changes of a feature. 9 PCs explained 60% of the variance. K-means clustering for a data-driven approach to grouping.
Why focus on the first two dimensions or PCs? What are they? The first two PCs explain a large amount of the variance (36%), and then there’s a steep drop off, or an ‘elbow’ after that. The remaining PCs are interesting, but progressively more noisy and less meaningful in describing my overall emotional state. PC1 is a general ‘Positive vs. Negative’ valence. Classification of emotions is far more than ‘good and bad’, but it’s still the strongest dimension before more nuance emerges. PC2 is something like ‘Activation vs. Calmness’. The positive pole mixes the good vs the bad, while the negative pole is barely loaded. Positive PC2 means high emotional intensity, and there are many ways to achieve that. There are comparatively fewer feelings associated with a flat, content, unremarkable day (and no negative emotions that factor into such a flat day).
This is a familiar result among other models of emotion. Russell's ‘circumplex model of affect’ identified valence/arousal as the two prominent axes of emotion.
Where do the features fit on the first two dimensions?
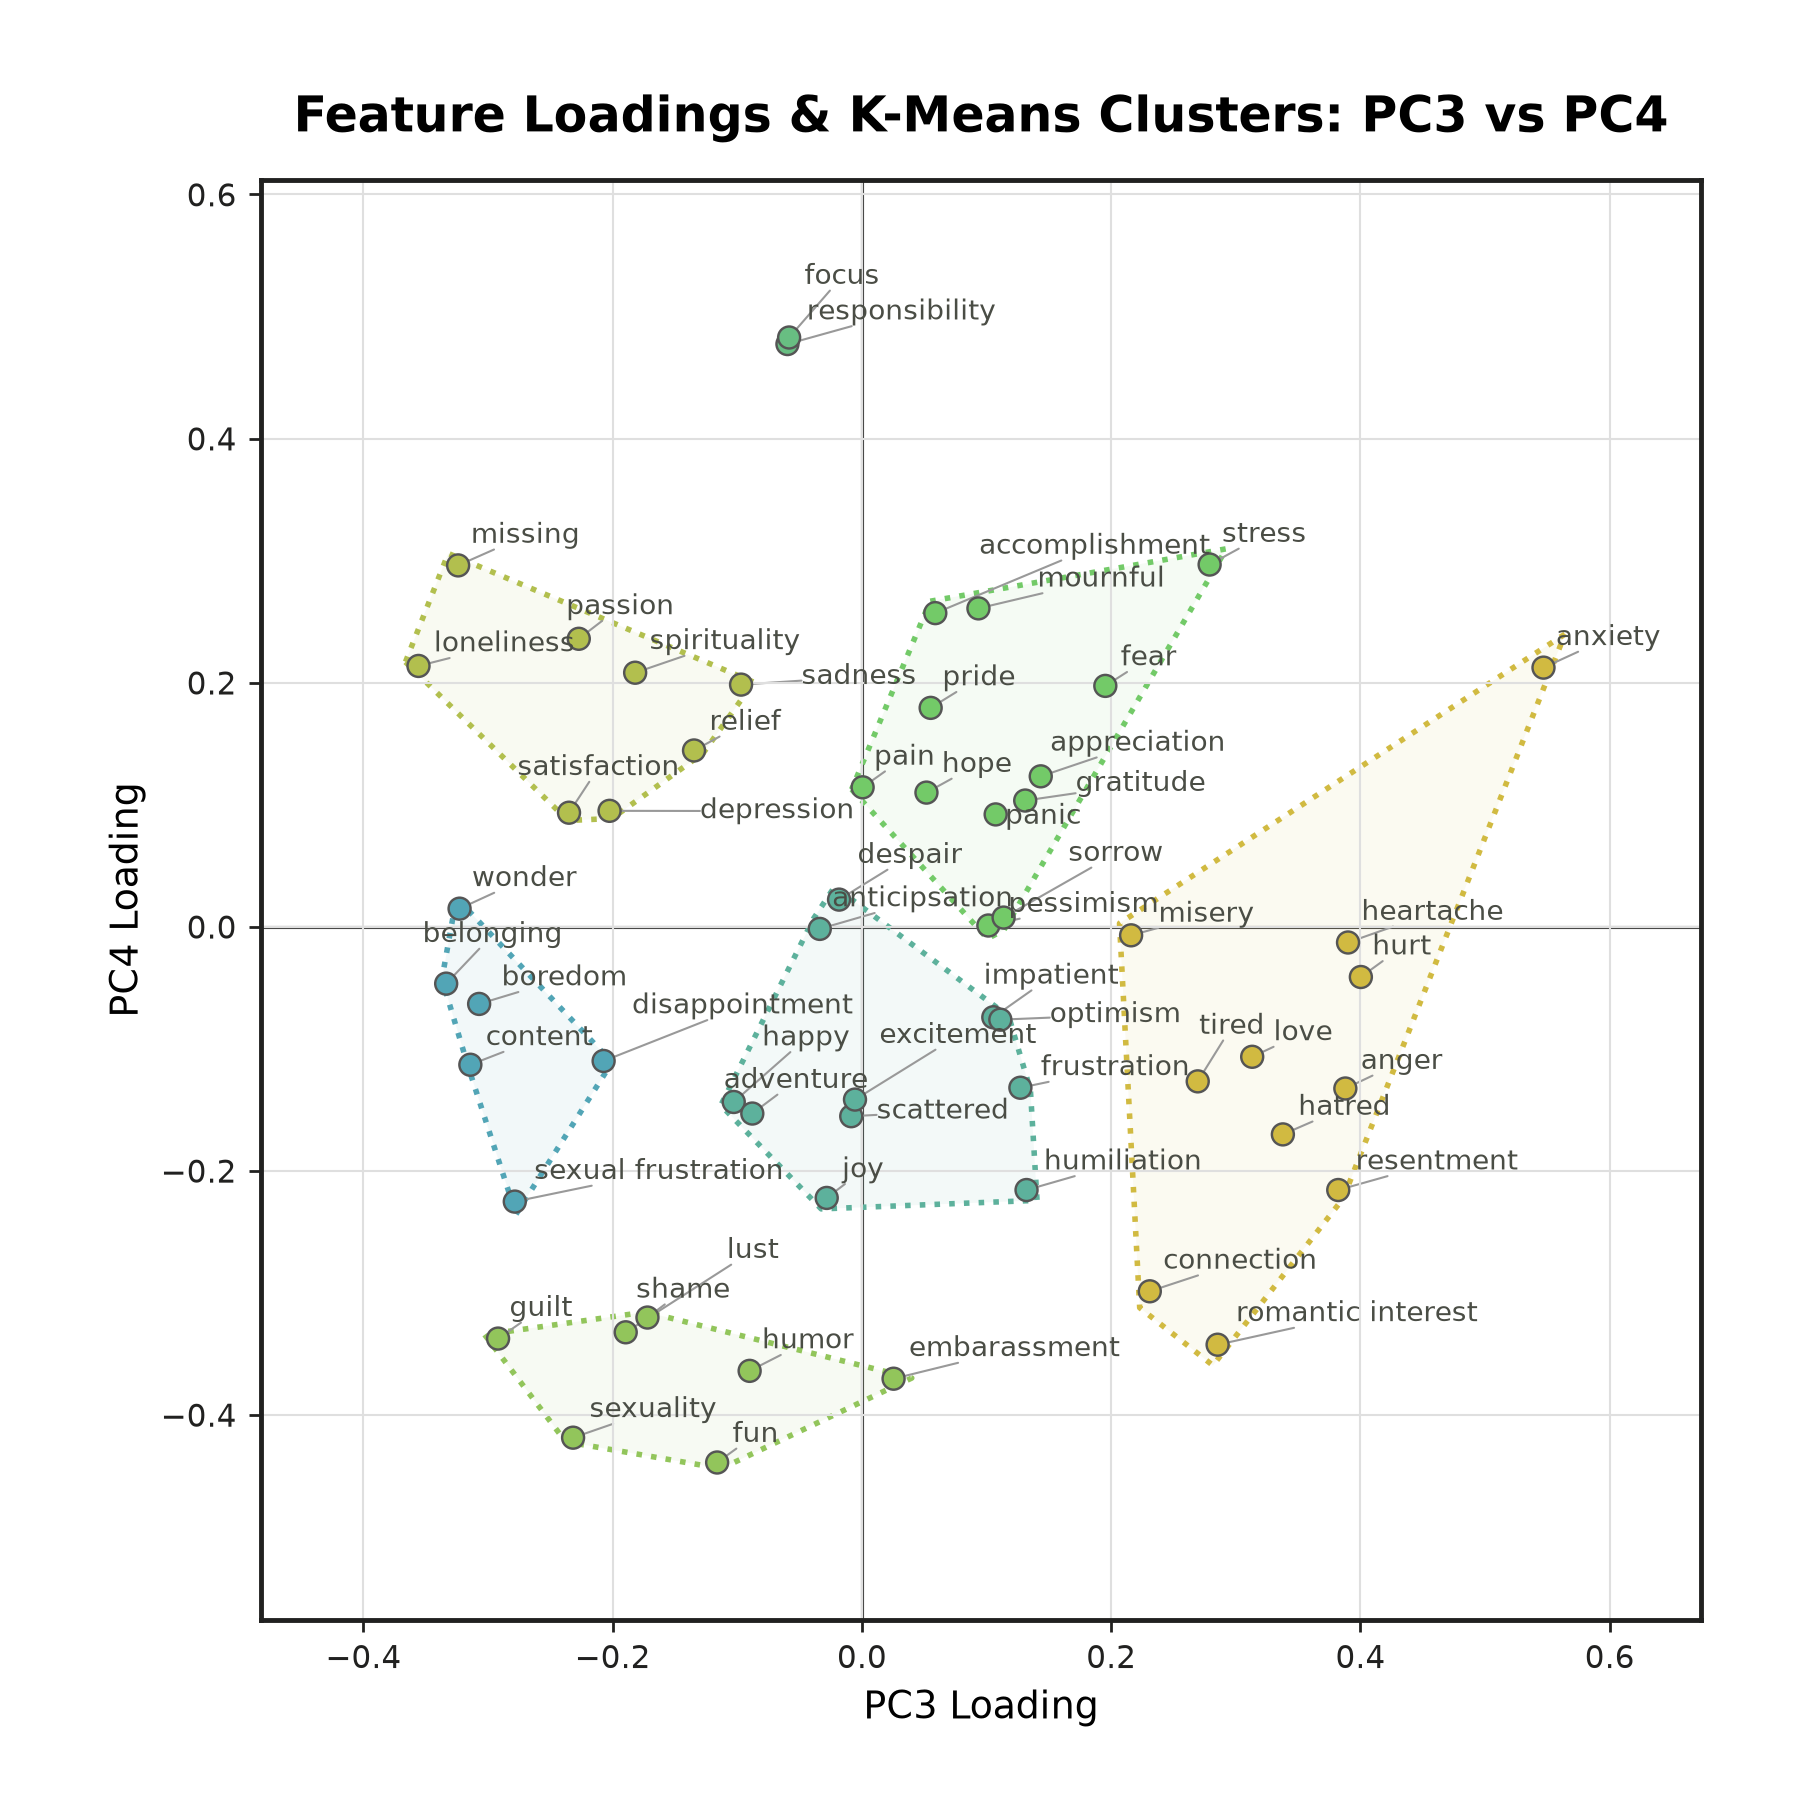
PC3: ‘Passionate Turmoil vs. Quiet Detachment’
PC4: Duty and Focus vs. Playfulness’
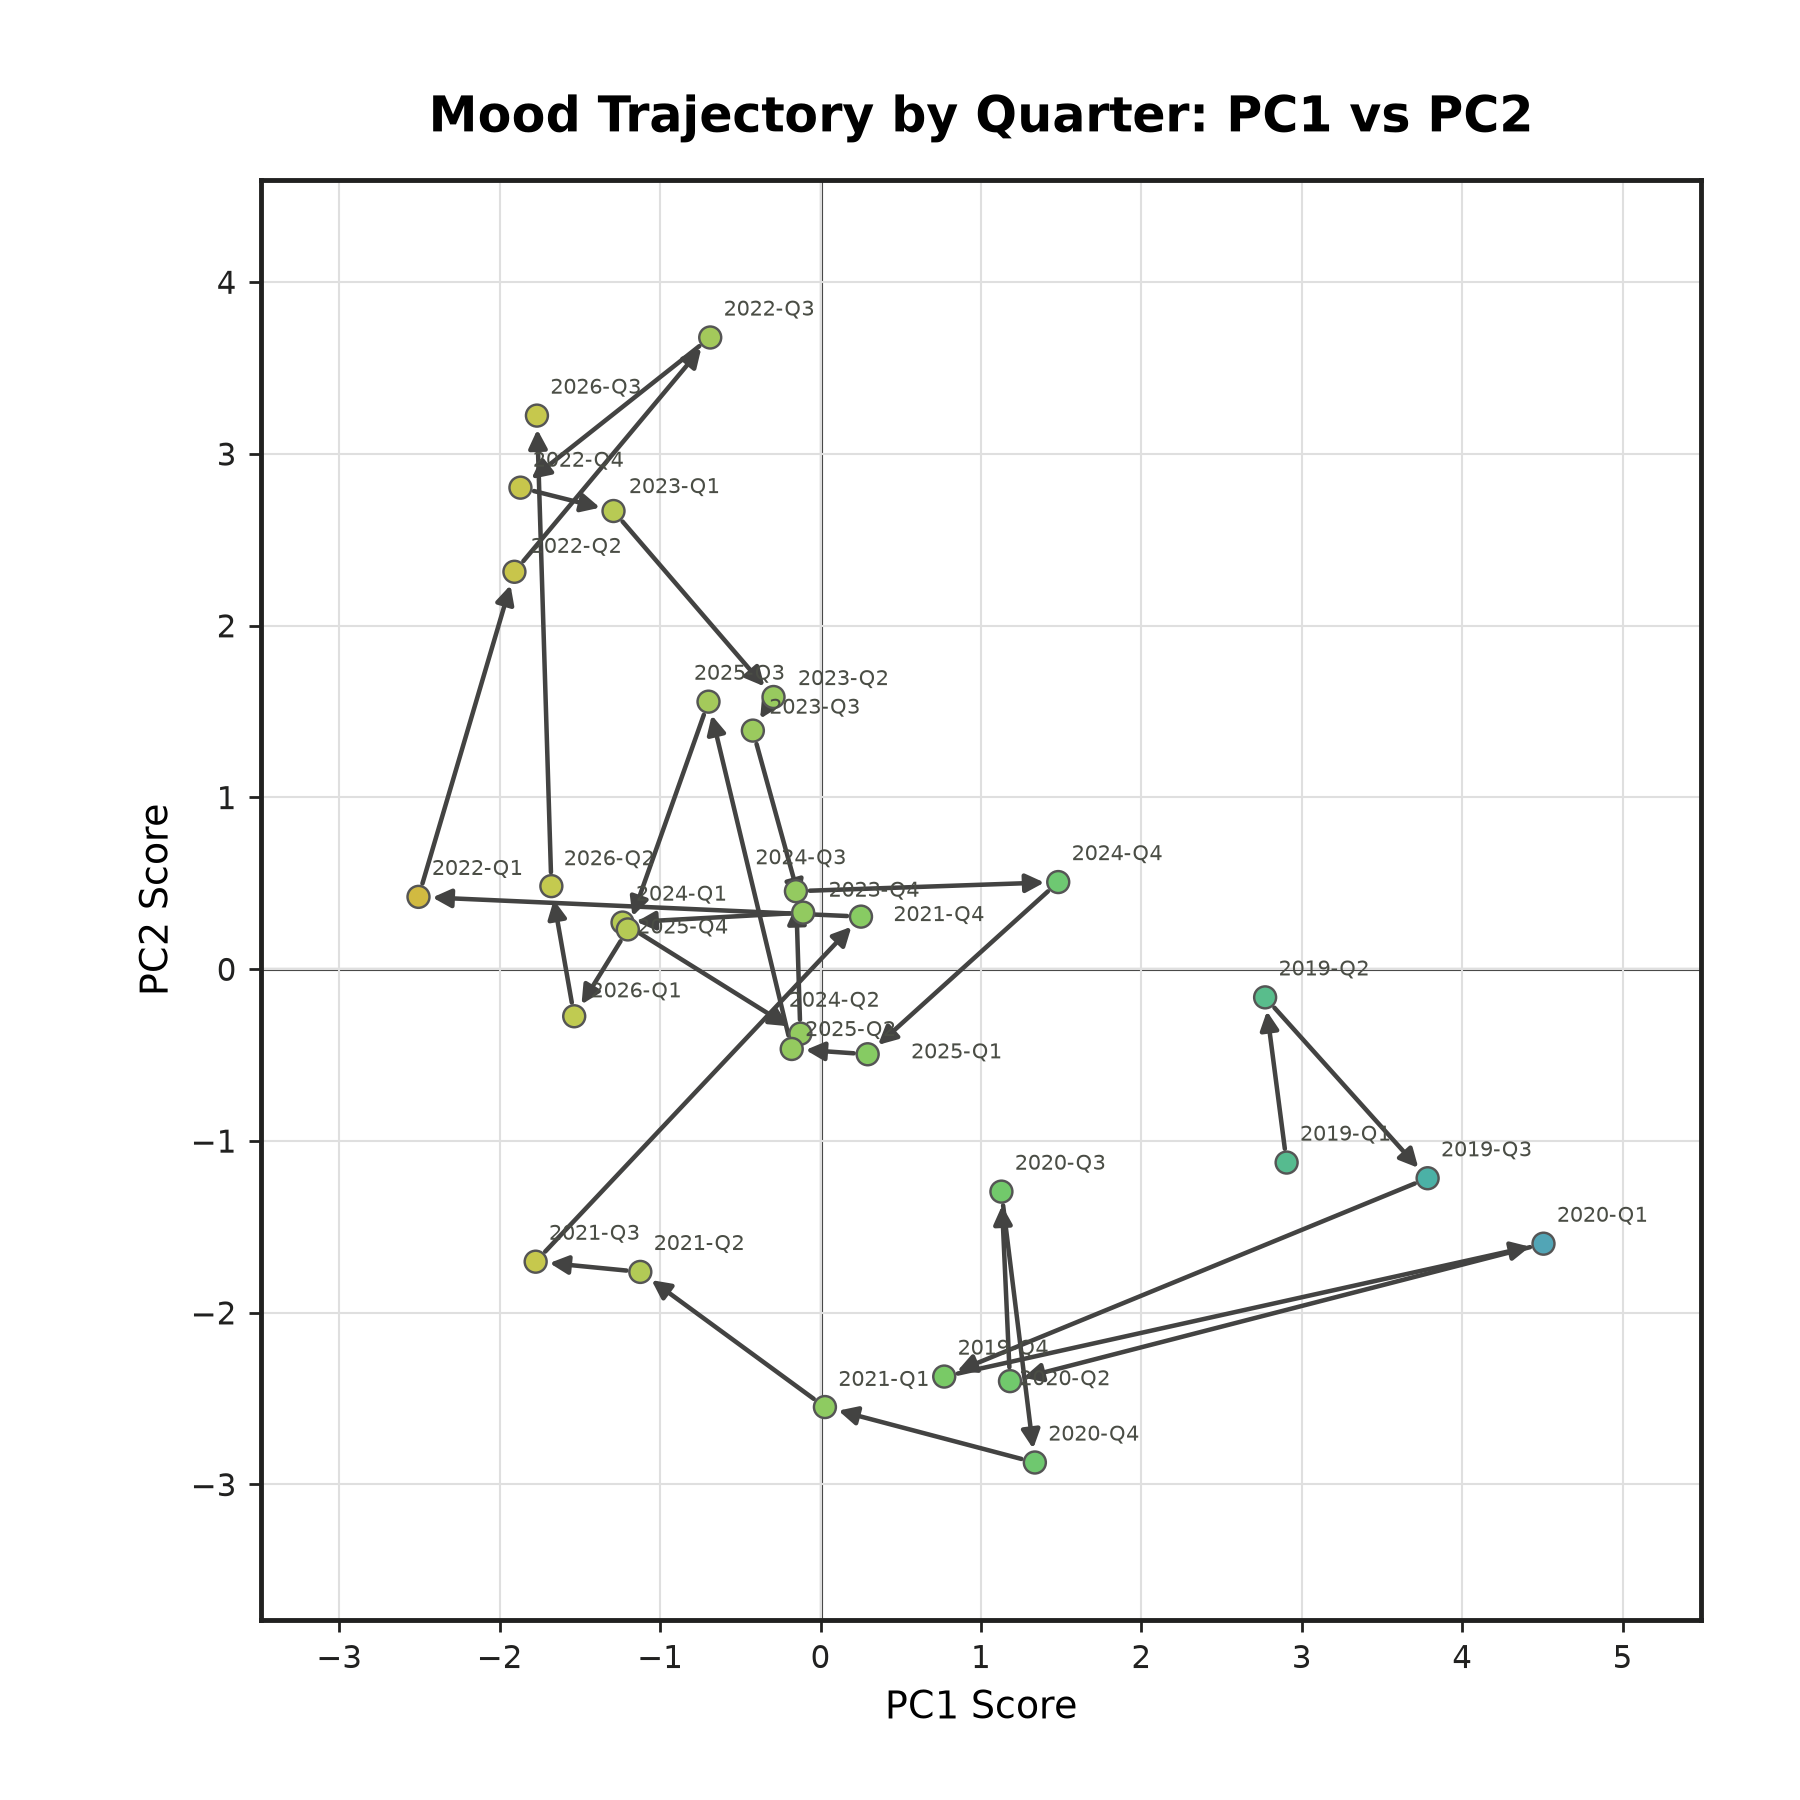
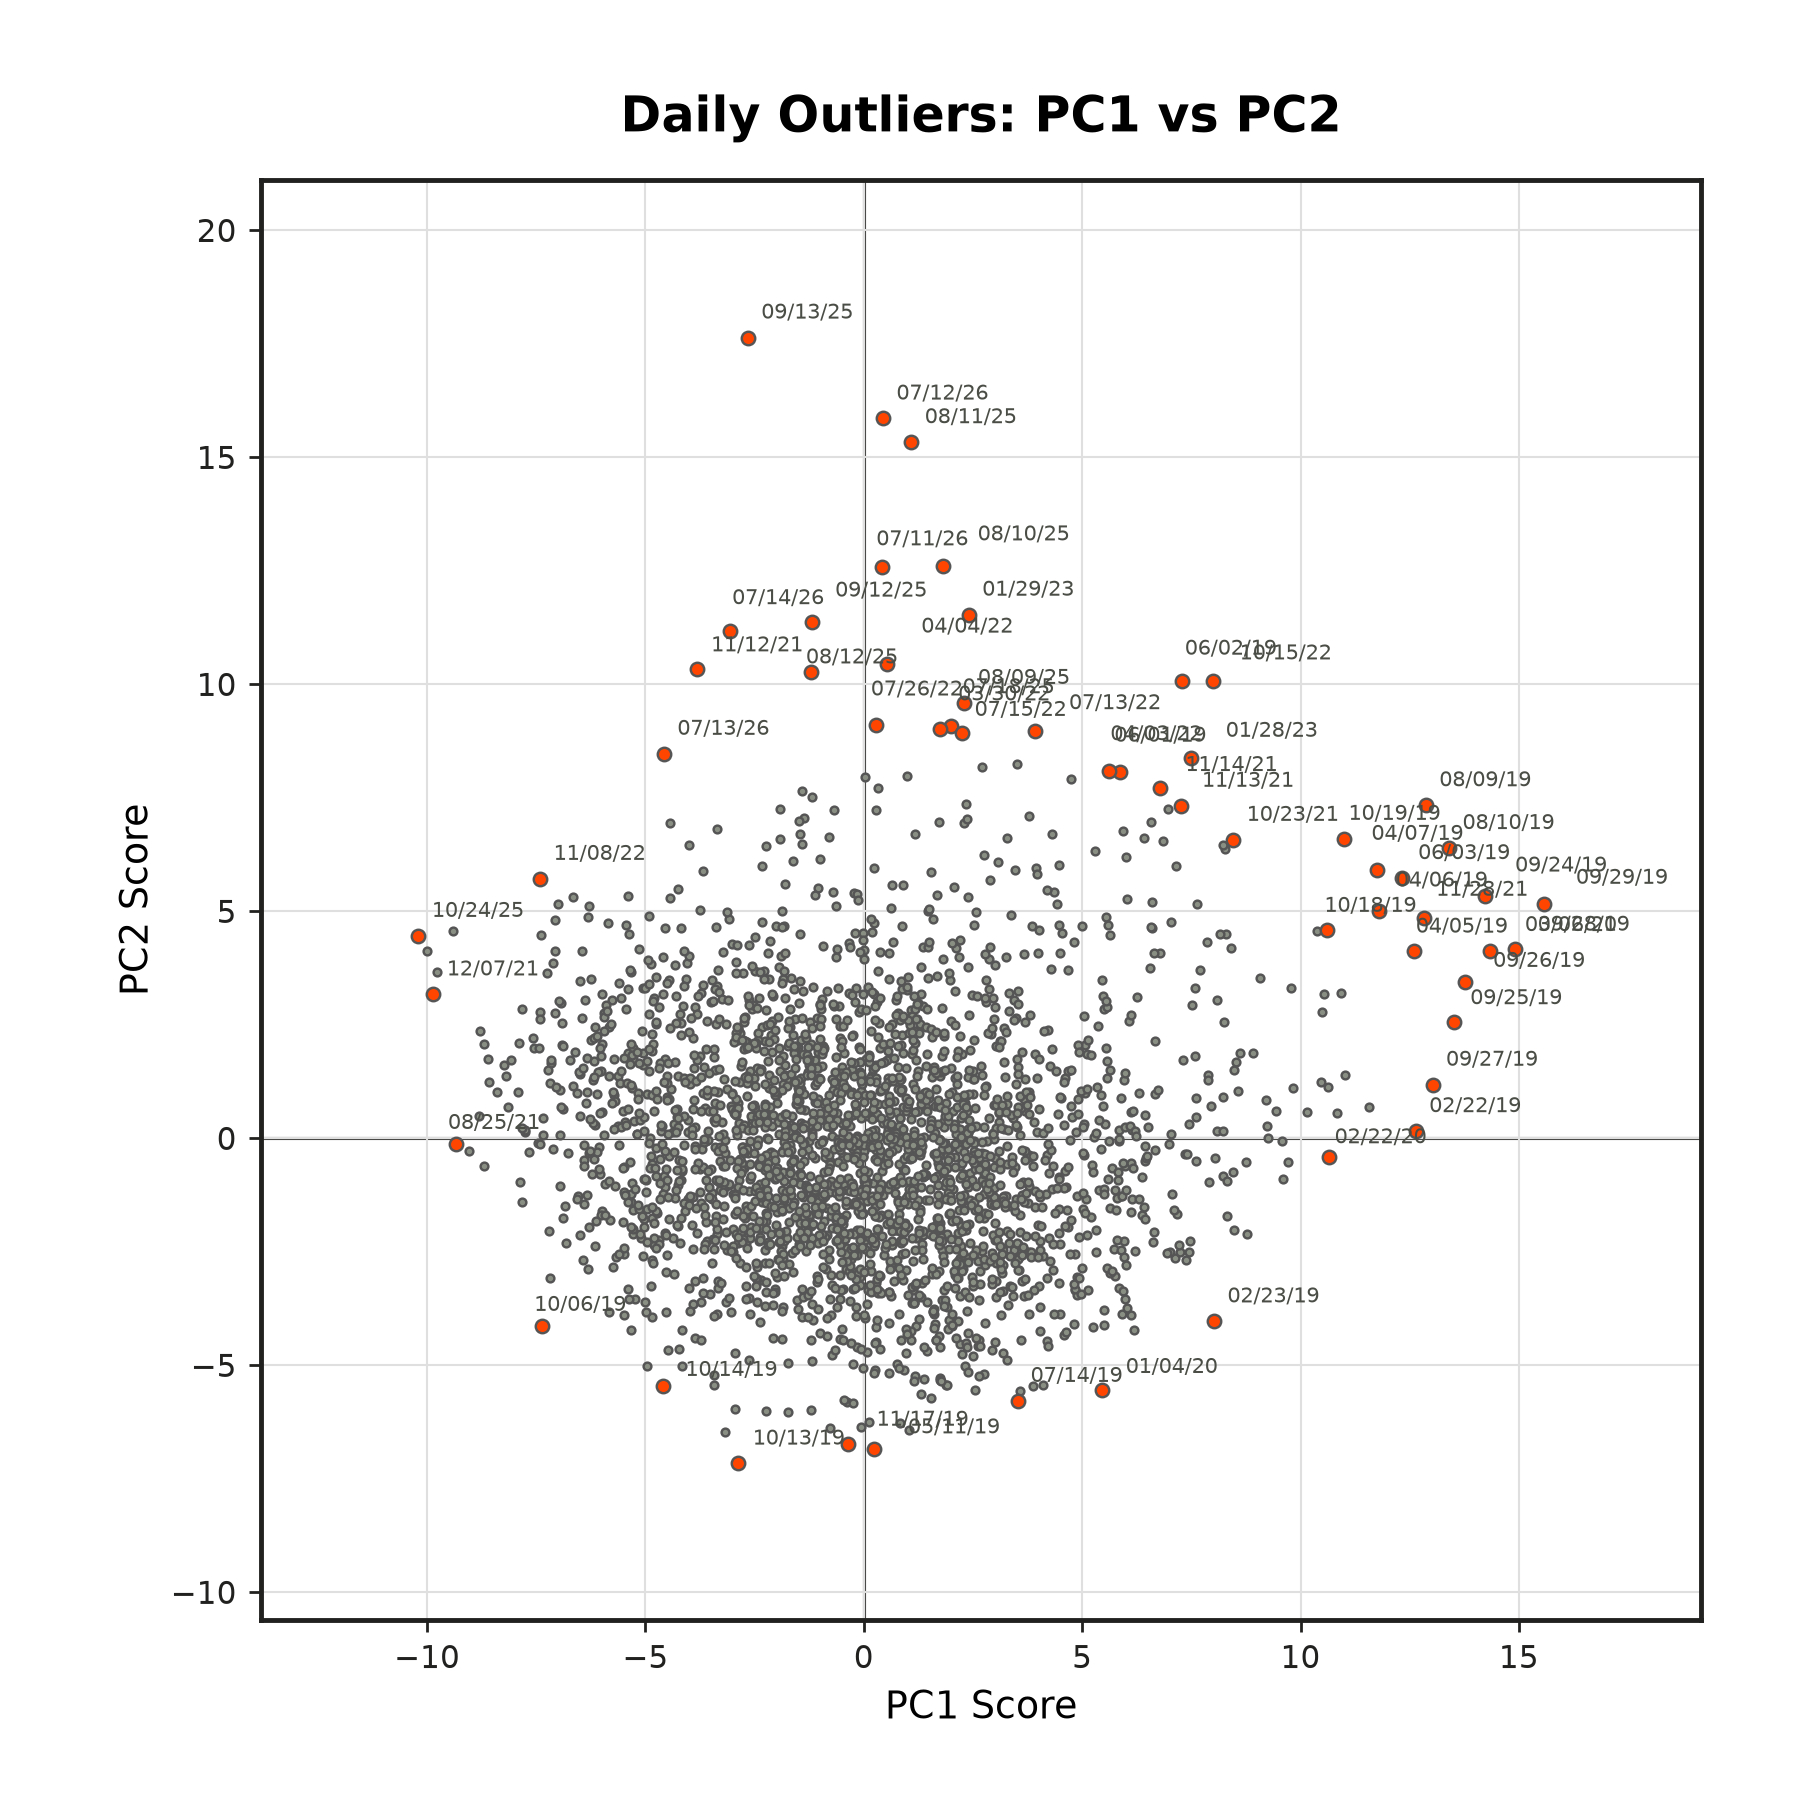
Outliers. The most extreme days.
I highlighted some daily outliers with a combination of Mahalanobis distance outliers + polar-sector outliers. Most of the Mahalanobis outliers (extreme distance from centroid in PC space) happen in the top right quadrant. I sampled the extremes in 20 different radial poles to get some outliers on the bottom and left.
9/13/25 is when I slept 1 hour on the ground, hiked on Mt Elbert for 7 hours starting at 5am, drove a few hours, ate enchiladas, pet cats in a parking lot, and couldn’t find a campsite in the Rio Grande National Forest until I fell asleep in my car at 1am. (And of course I recorded my daily log of emotions). Big day! Any high-PC2 day is going to be easy to remember.
9/29/19 was a leisurely road trip on the Olympic Peninsula. Hoh National Forest, Ruby Beach, Hungry Bear Cafe, and I think there was pizza.
10/24/25 and 10/13/19. I don’t remember and didn’t record anything about these days, but I guess that’s the point.
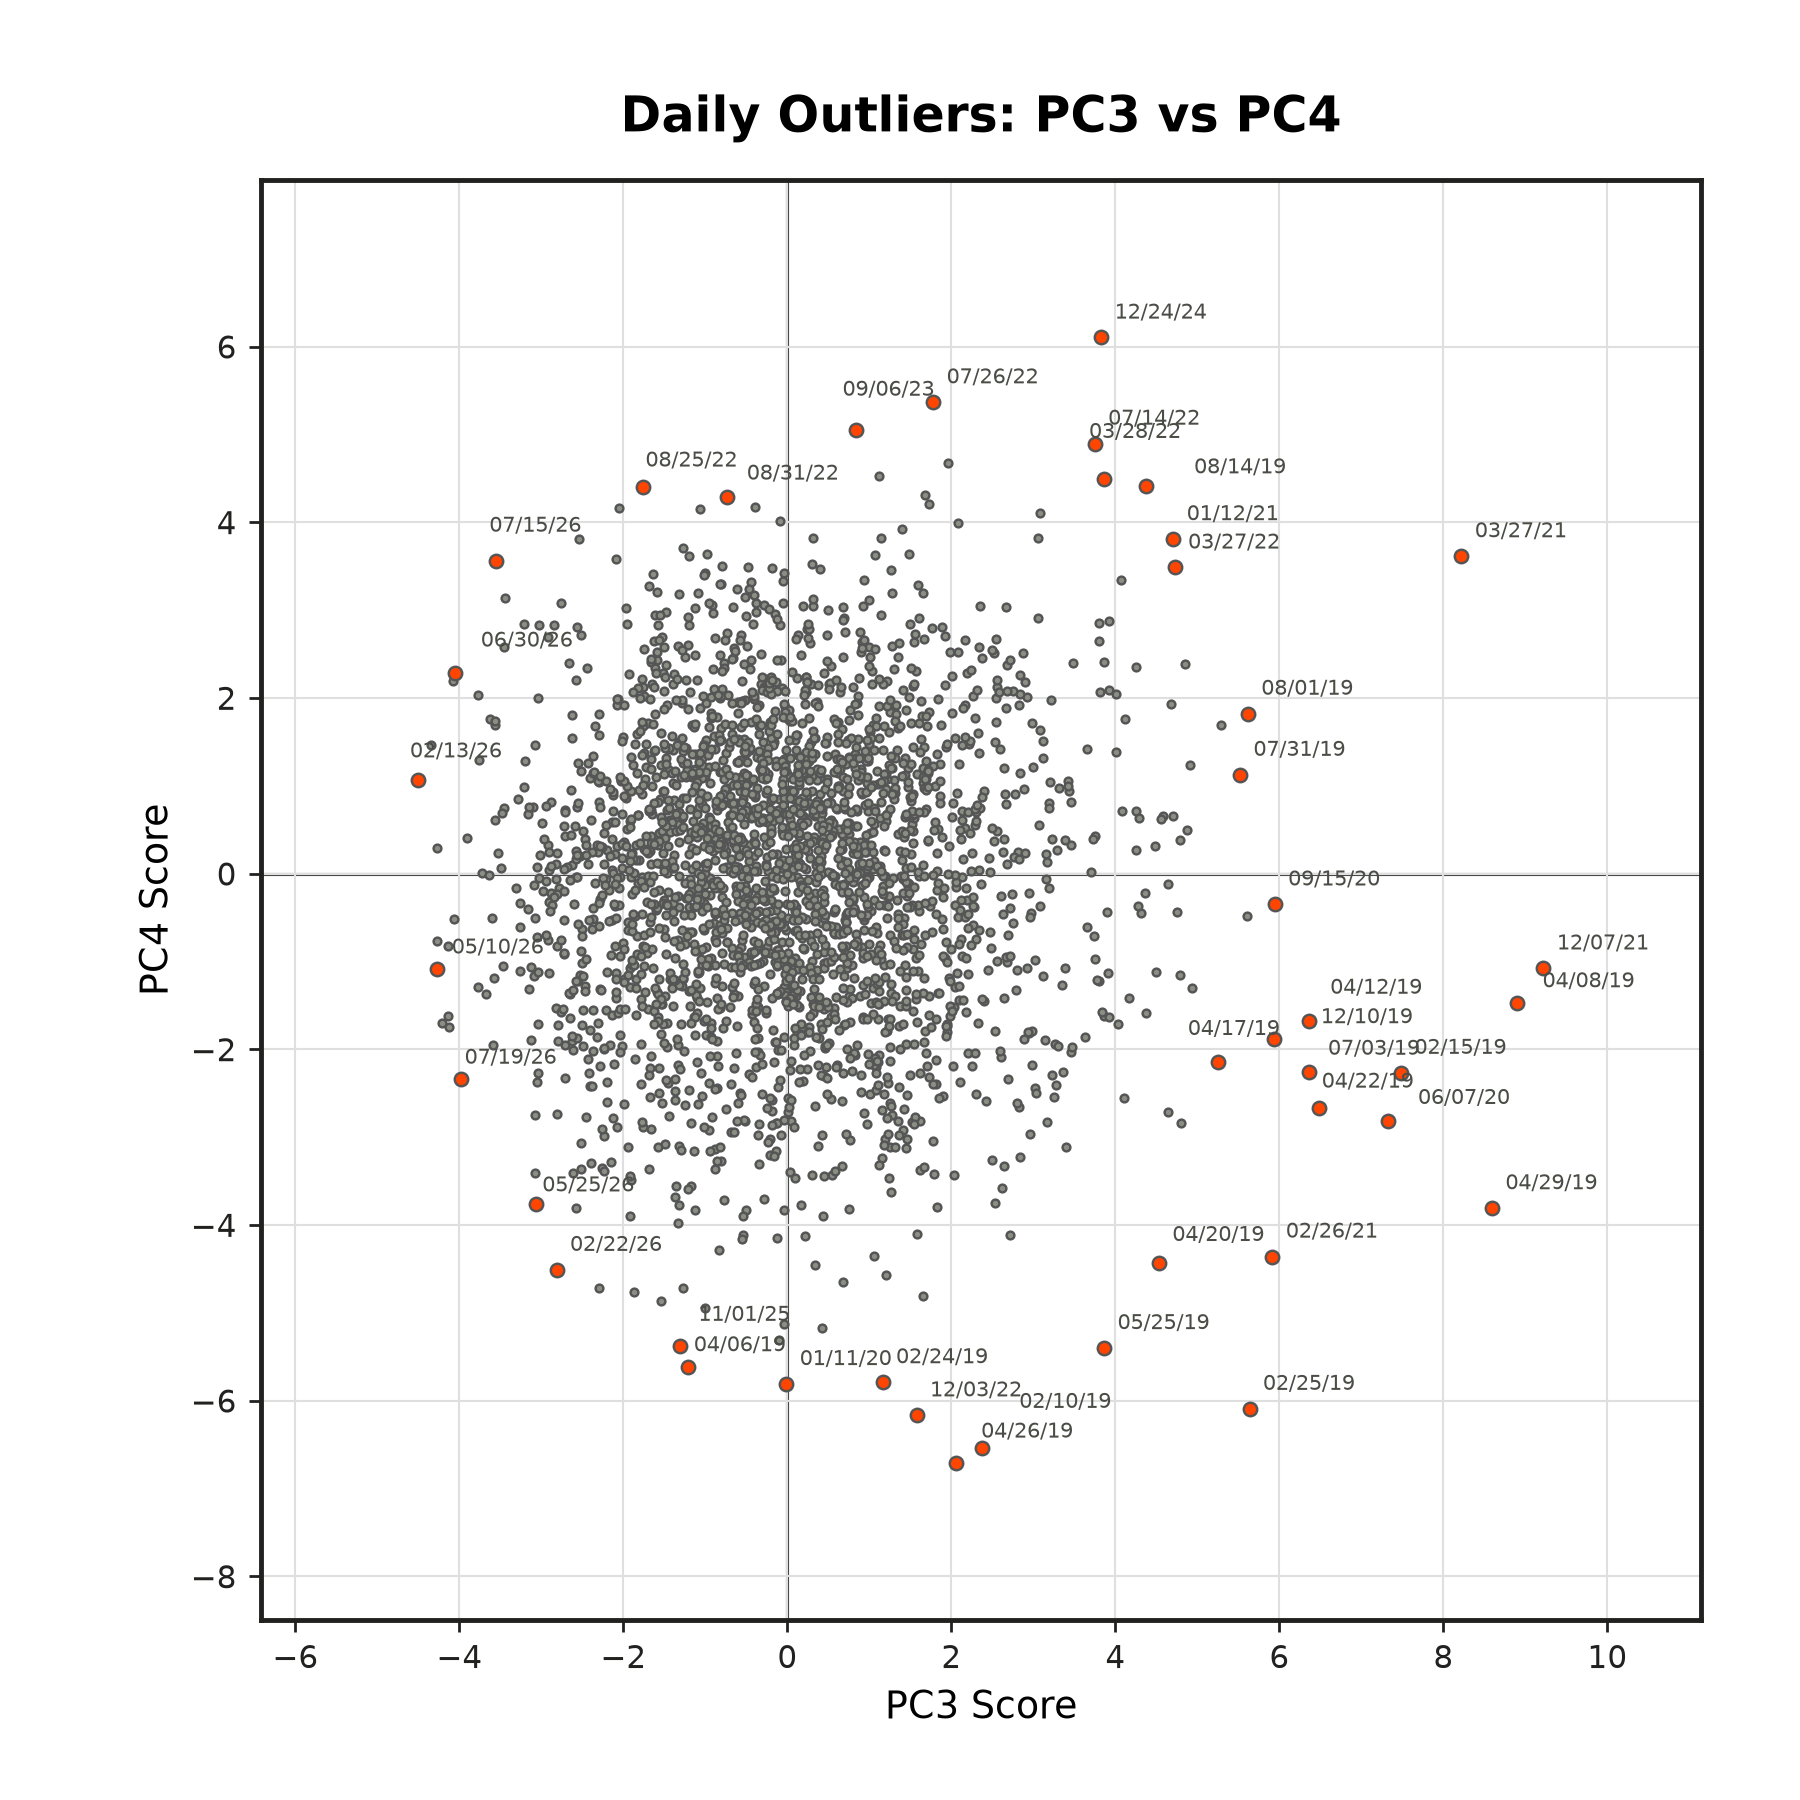
What are the rest of the PCs? I exported a list of feature loadings (positive and negative) for each PC and asked Claude to find some signal in the noise. Here is the full list of interpretations.
"General Positive vs. Negative Affect"
"Emotional Intensity vs. Flat Calm"
"Passionate Turmoil vs. Quiet Detachment"
"Duty & Focus vs. Playful"
"Agentic Drive vs. Tender Vulnerability"
"Longing vs. Social Self-Consciousness"
"Grief/Heartbreak vs. Restless Weariness"
"Anxious Fear vs. Settled Security"
"Scattered Tension vs. Weary Heartache"
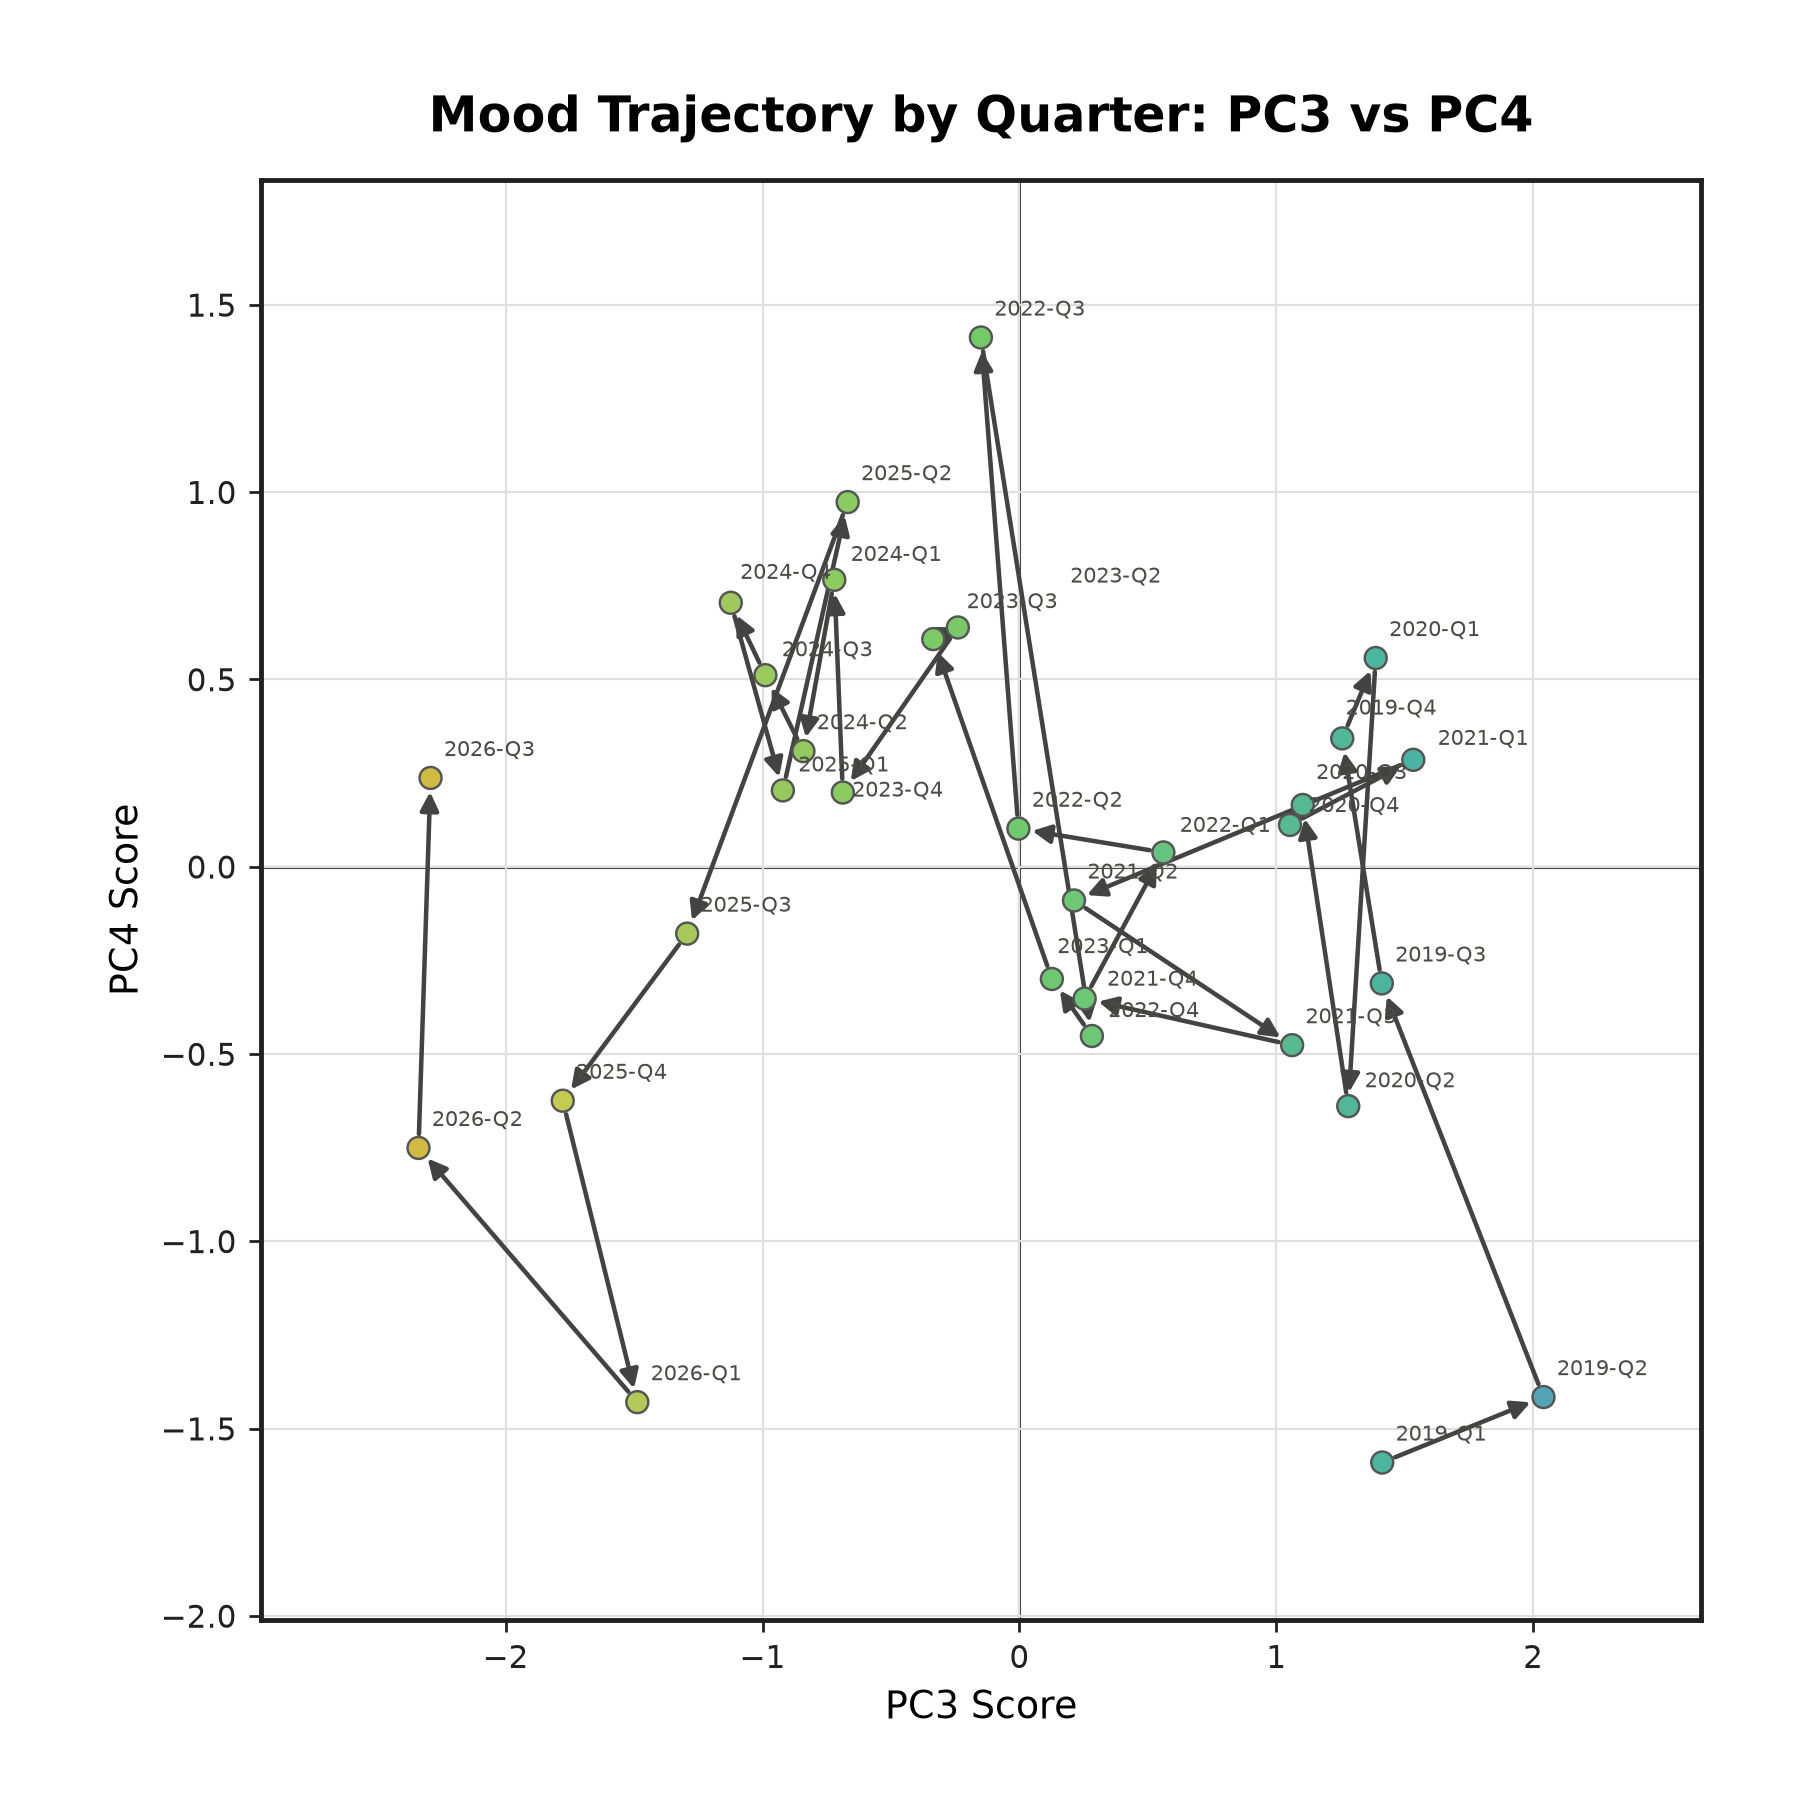
Limits of Interpreting a P-technique / n of 1 study. As it gets deeper into the list of PCs (anything beyond 2), the interpretation of PCs becomes very personalized, and dependent on the specific life circumstances of the individual. For example, most PCs around 3-5 seem to be reflective of what city I’m living in or my specific living situation. In other words, they’re mapping to my calendar more so than a generalizable rule of human emotion. I would be interested to see similar longitudinal studies on other individuals.