
Machine learning is being used to classify DNA sequences, recognize speech, and perform medical diagnoses. So far, all I can do with it is tell you how likely it is to rain in your corner of the country this year.
in 2017, Proving Ground released a new Machine Learning addition of LunchBox, their Grasshopper plugin, called LunchBoxML. This includes a few open source components built on the machine learning library Accord.NET. One of the simplest and most useful tools is the non-linear regression algorithm.
Non-Linear Regression, Proving Ground.
Simply put, it uses a few training points to predict what the rest of the surface might look like. This lends itself perfectly to a problem I've worked on: Taking data from a few weather stations across the US to predict climate data for every site in between. There are two problems with EPW weather files. The first is that they are only available for relatively few locations, sometimes hundreds of miles apart. It's usually acceptable to use the nearest weather station, but it would be nice to have unique data for all of our building sites outside of major cities. The second problem is that EPW weather files don't include rainfall data. To make the automation of climate analysis possible, the best solution would be to enter the latitude and longitude of a site, and then let the algorithm predict the weather data based on an EPW library, and the rainfall data based on another rainfall library.
I started with a relatively small rainfall library. I have monthly rainfall averages for 26 different cities in an Excel spreadsheet, each of which have a longitude and latitude.

For these visualizations, I'm looking at the annual total rainfall, from 8 inches in Phoenix, to 67 inches in Pensacola.

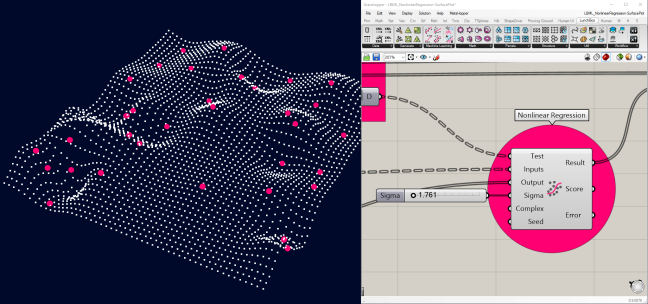
The Grasshopper script reads the Excel library (on the left) and gets plugged into the non-linear regression algorithm (on the right). The rest of the components are for displaying the tags and results.

Now it's time to fine tune the Sigma value, the degree of the prediction curve. This is one of the inputs into the regression function. A low Sigma value will cause the effect of each data point to "decay" too quickly and not affect it's surrounding test points.

A high Sigma value decays too slowly and smooths out the test surface too much.

Somewhere in the middle, it starts to look like a reasonable model.

This model will benefit a lot from more data points. Increasing the library from 26 cities to a few hundred will make a much finer resolution model. This is especially important for the western US. Whereas the eastern US is much more predictable, the west has more extreme topography that creates more locally unique micro-climates. Now, it's a simple matter of adding more data points to the library, and it will begin to look much more like the map below.

Spatial Climate Analysis Service, Oregon State University