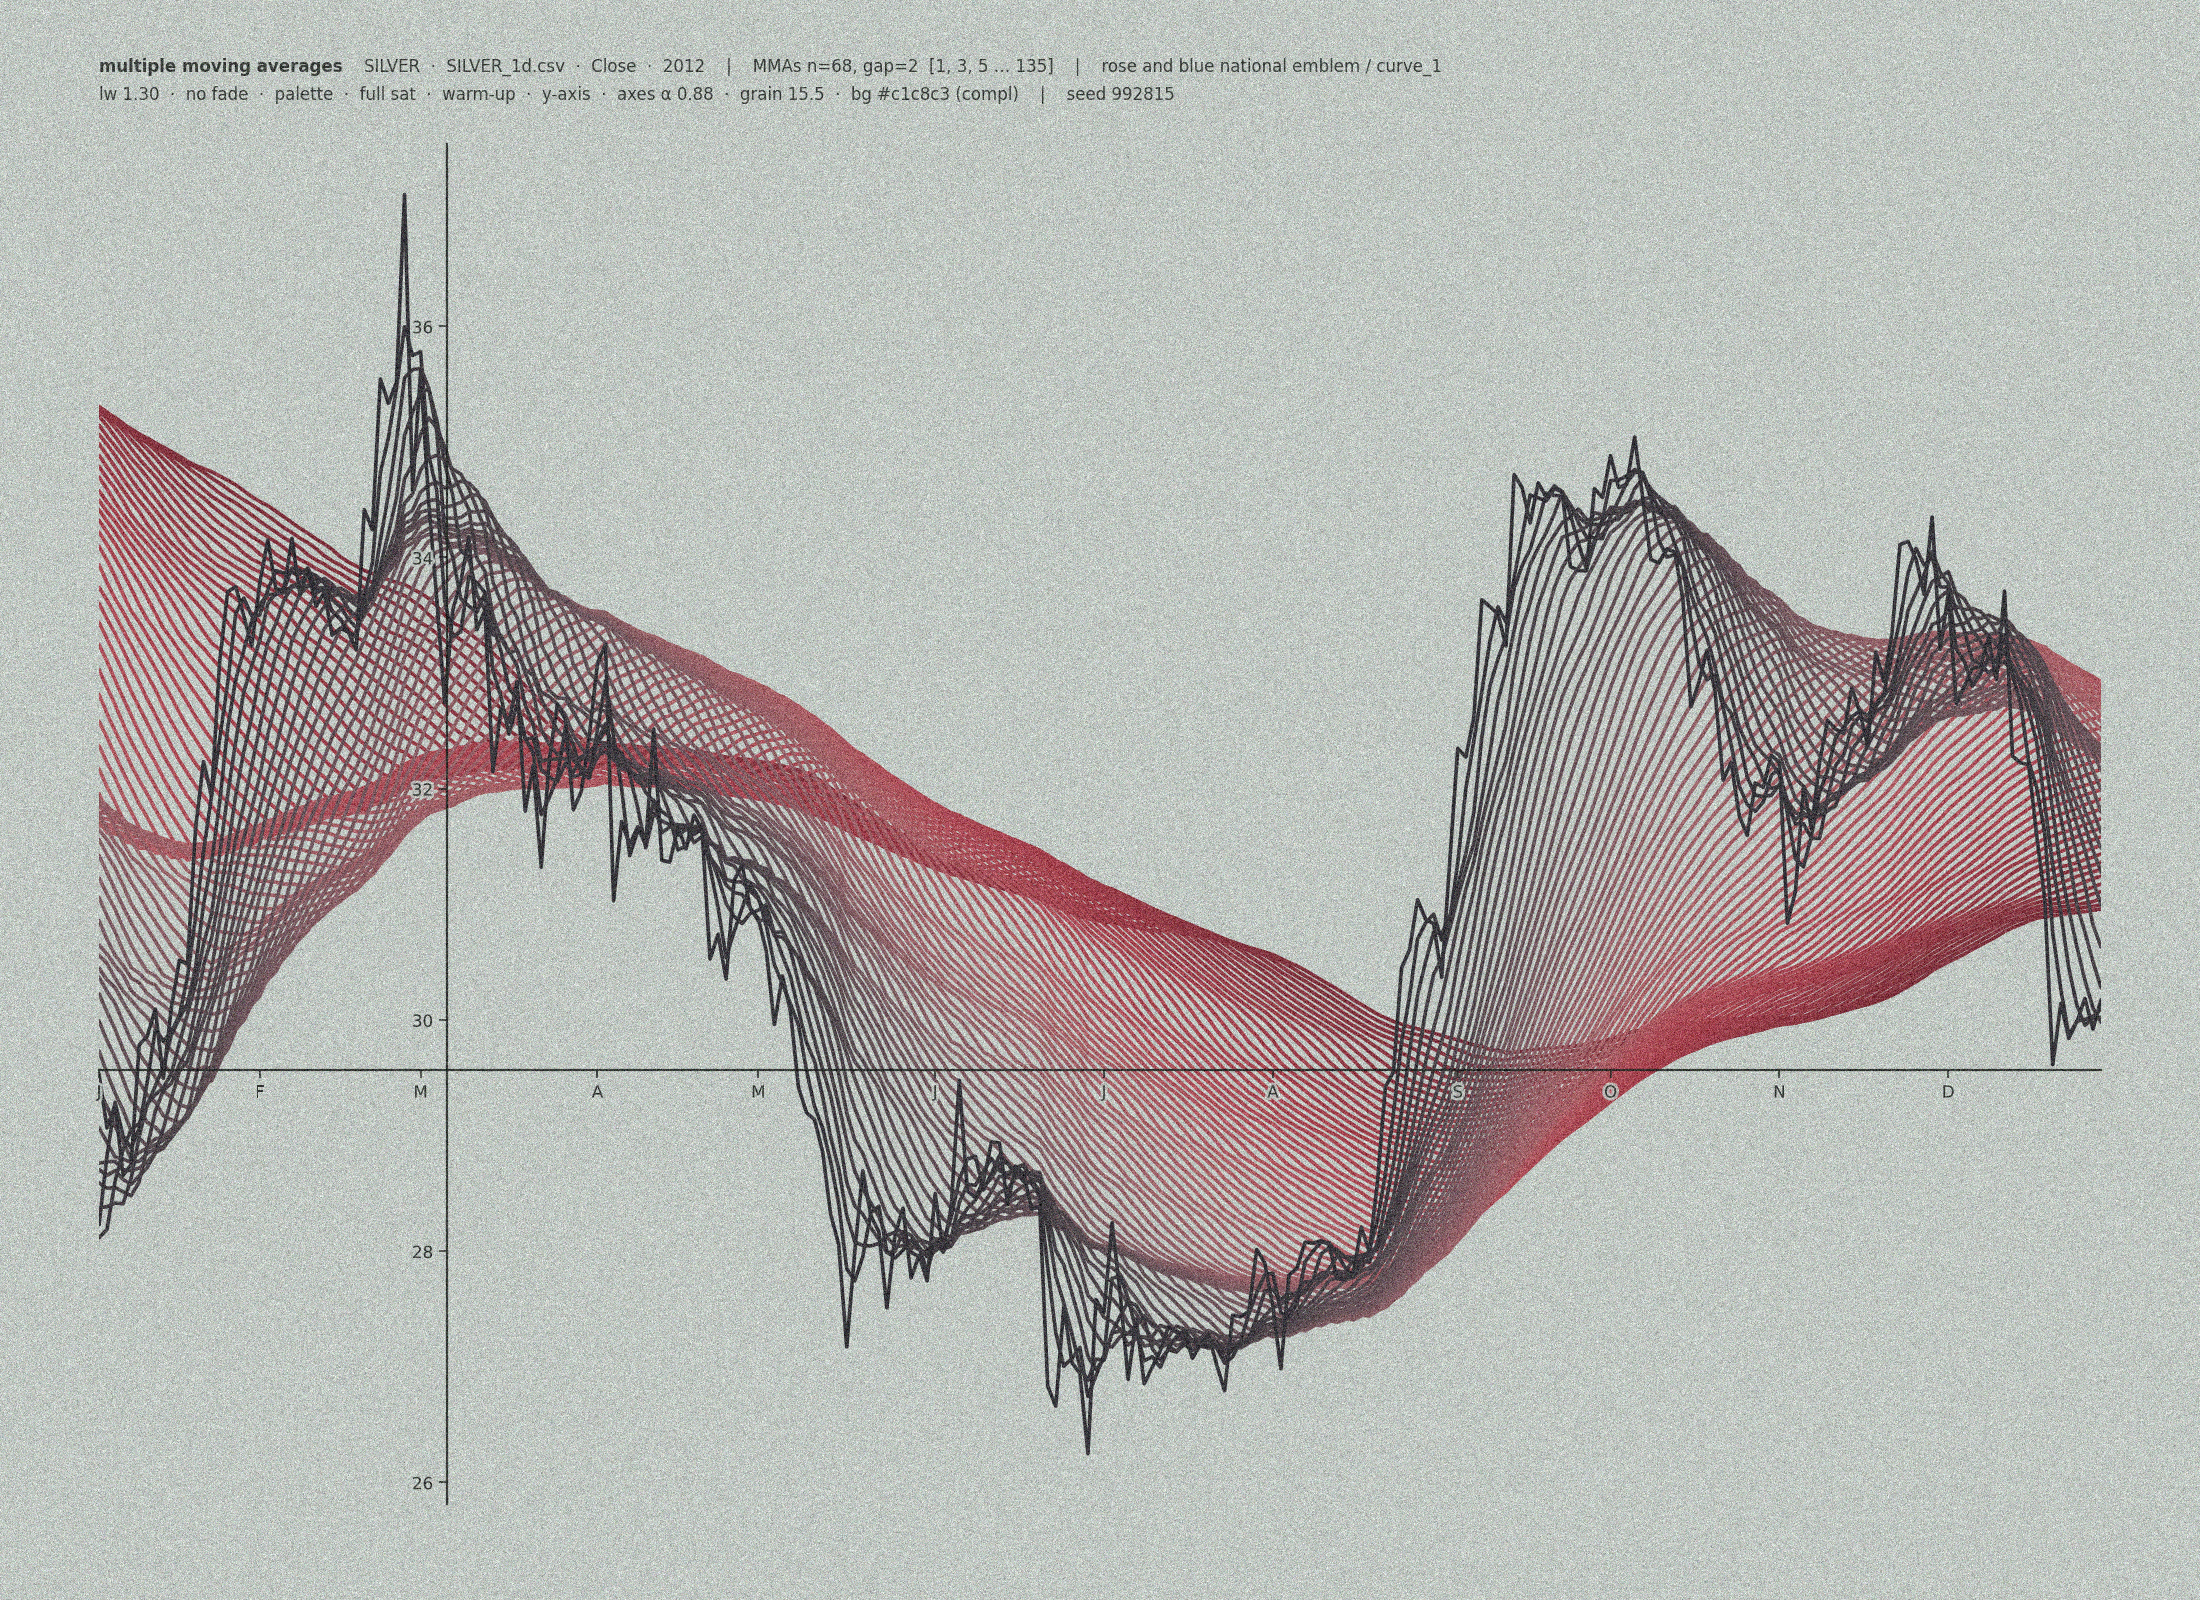
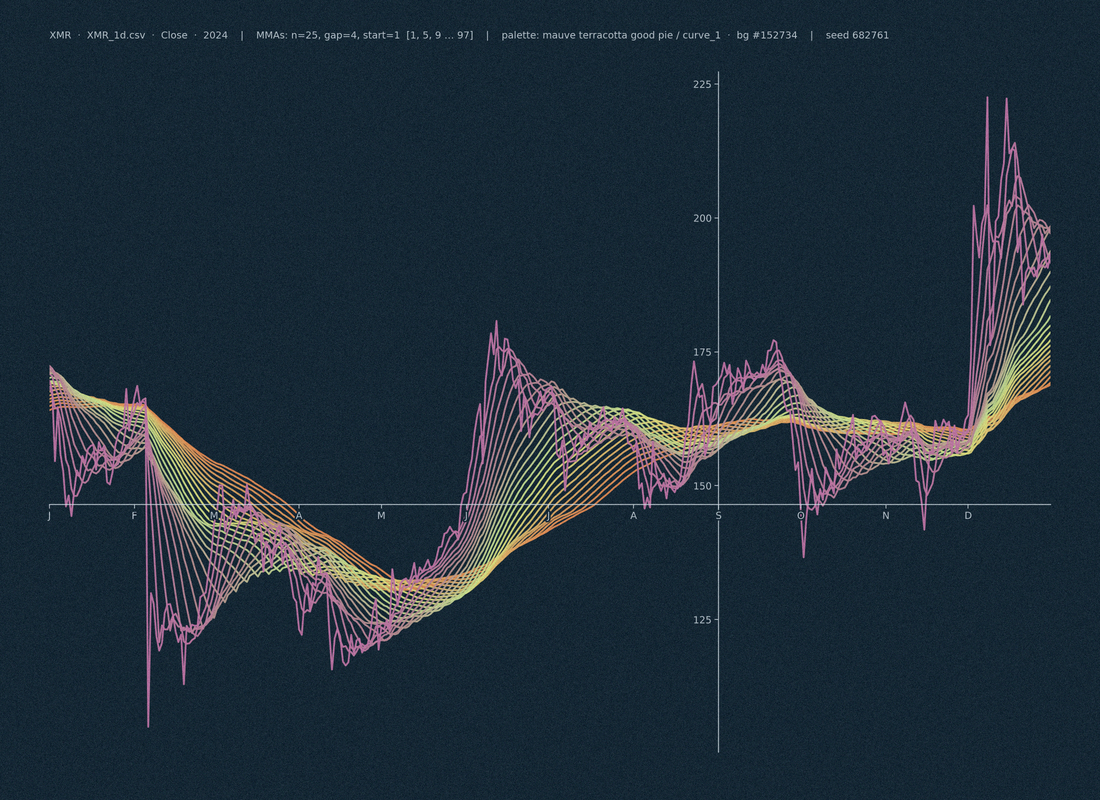
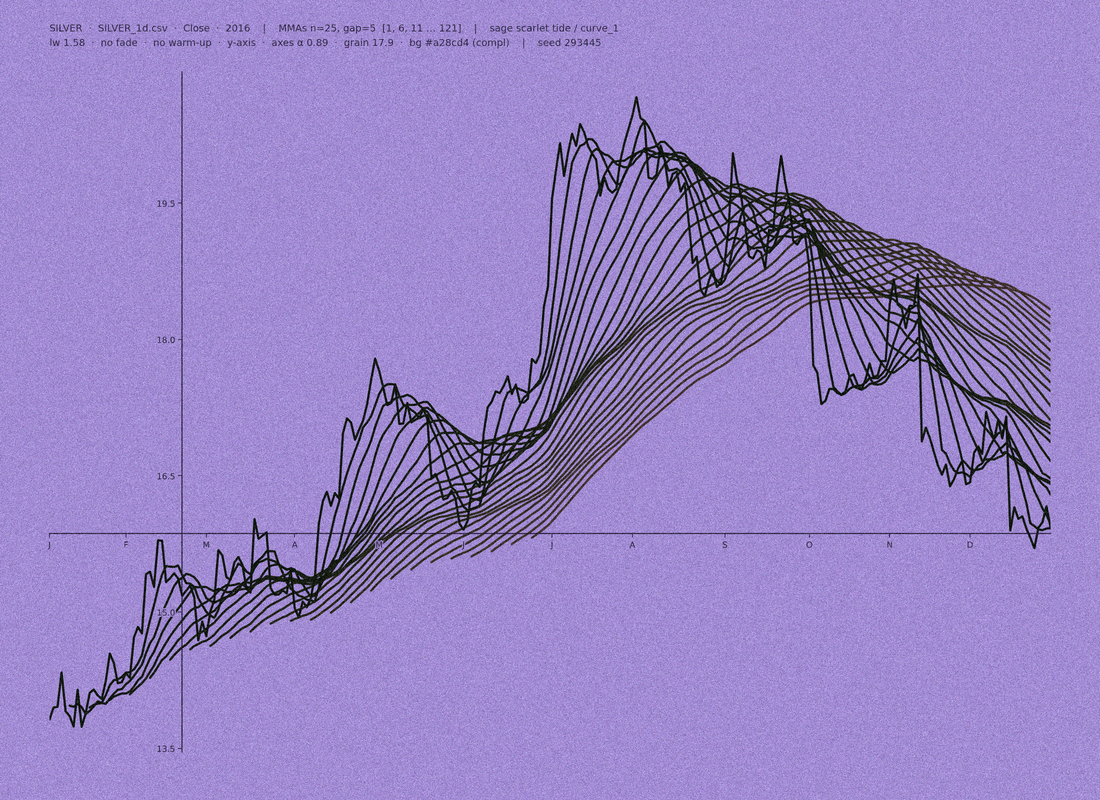
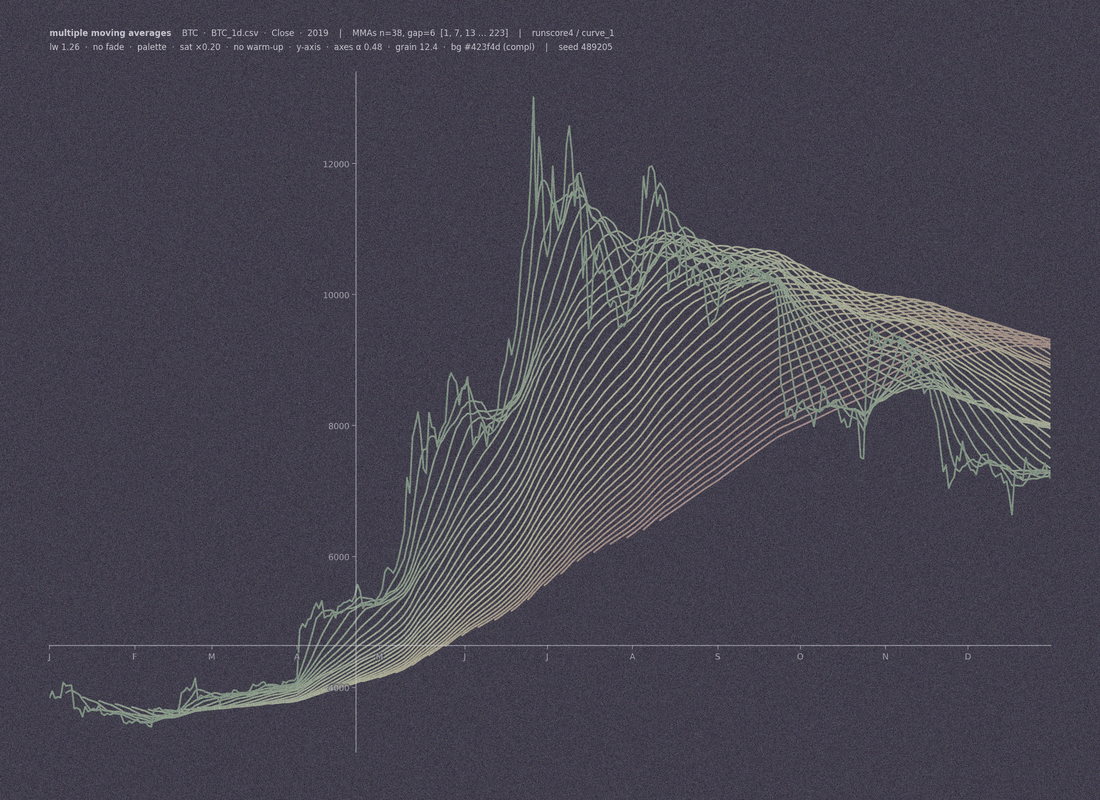
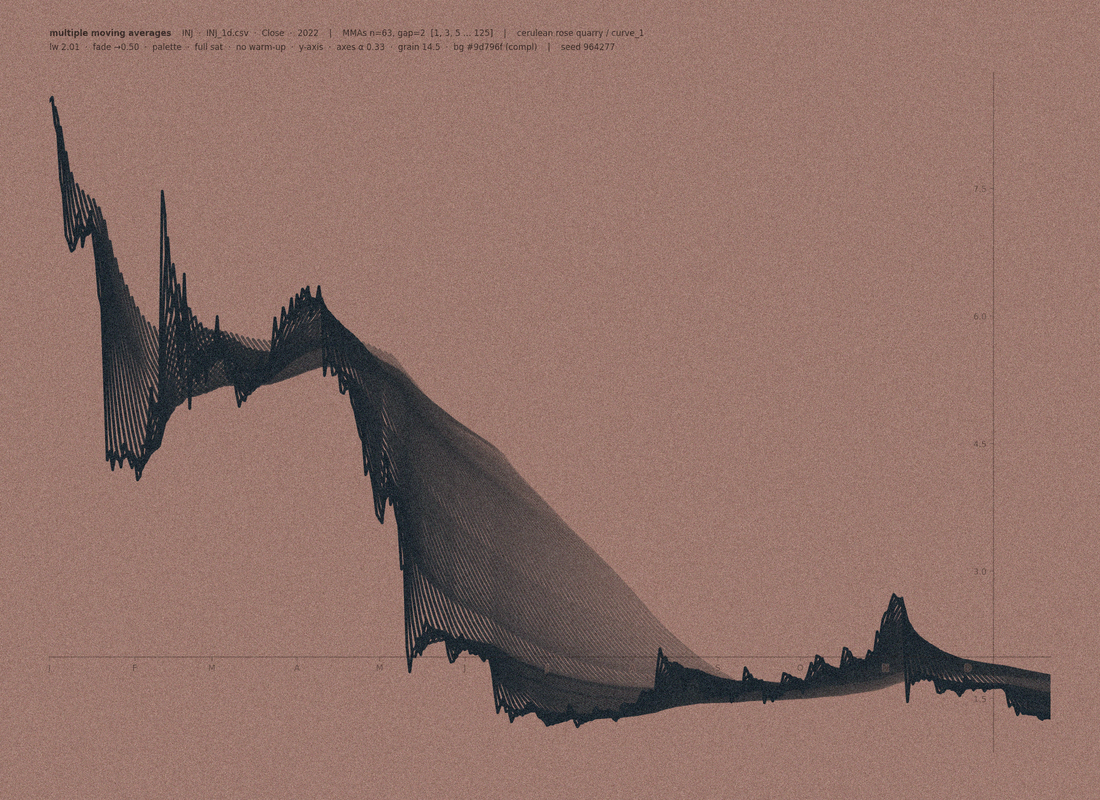
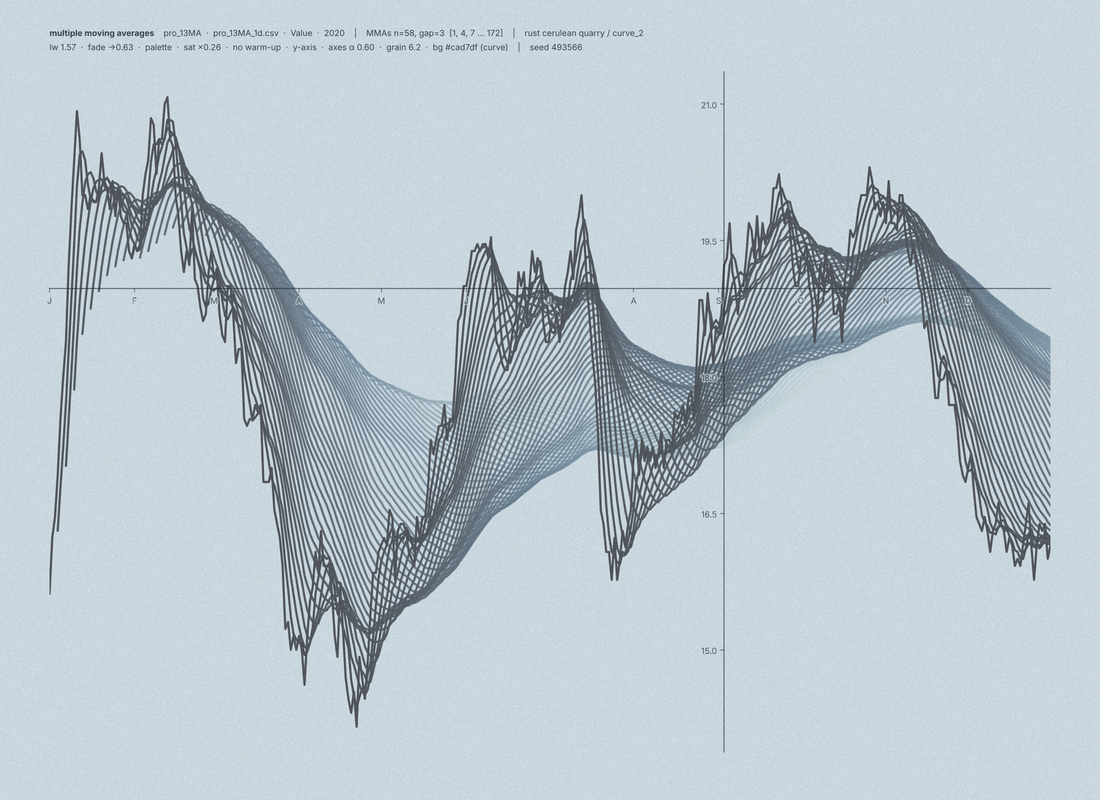
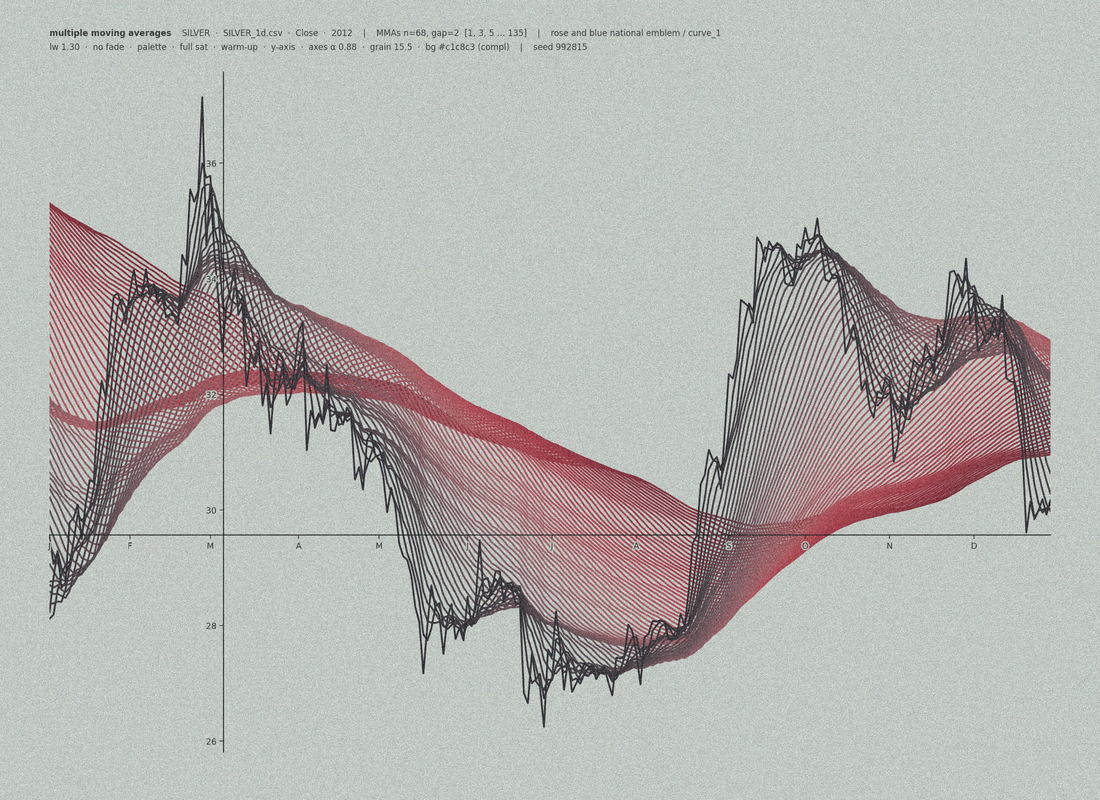
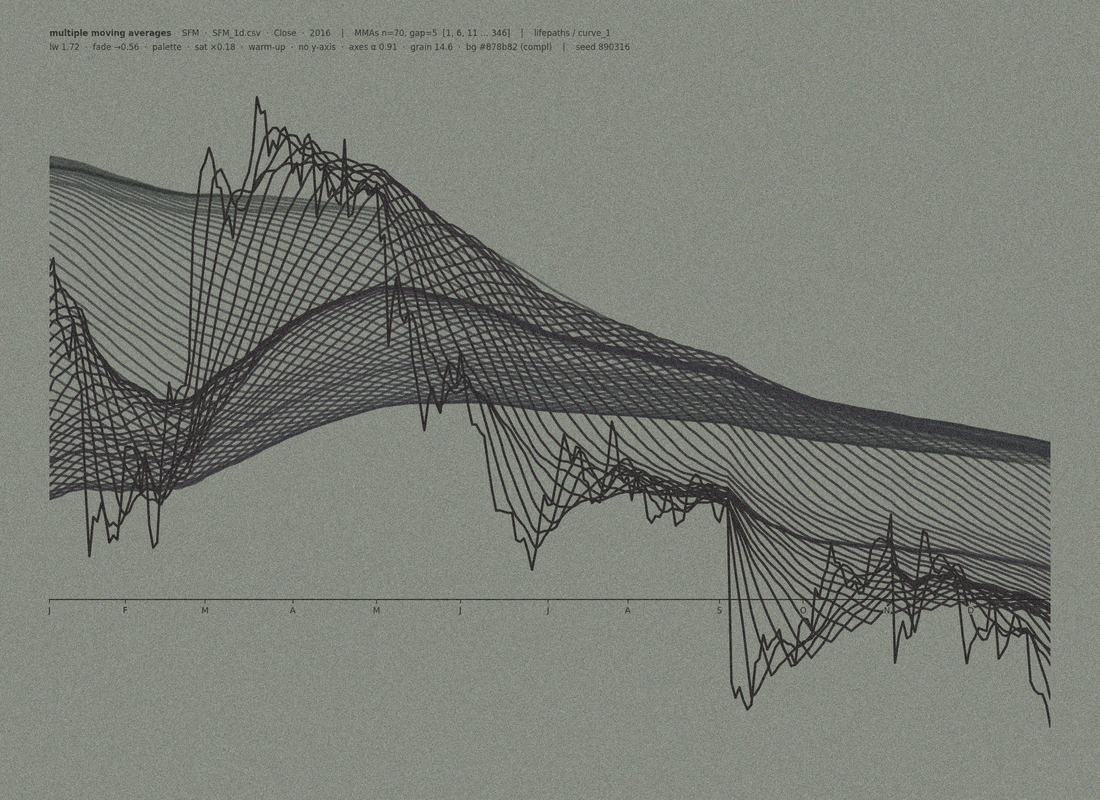
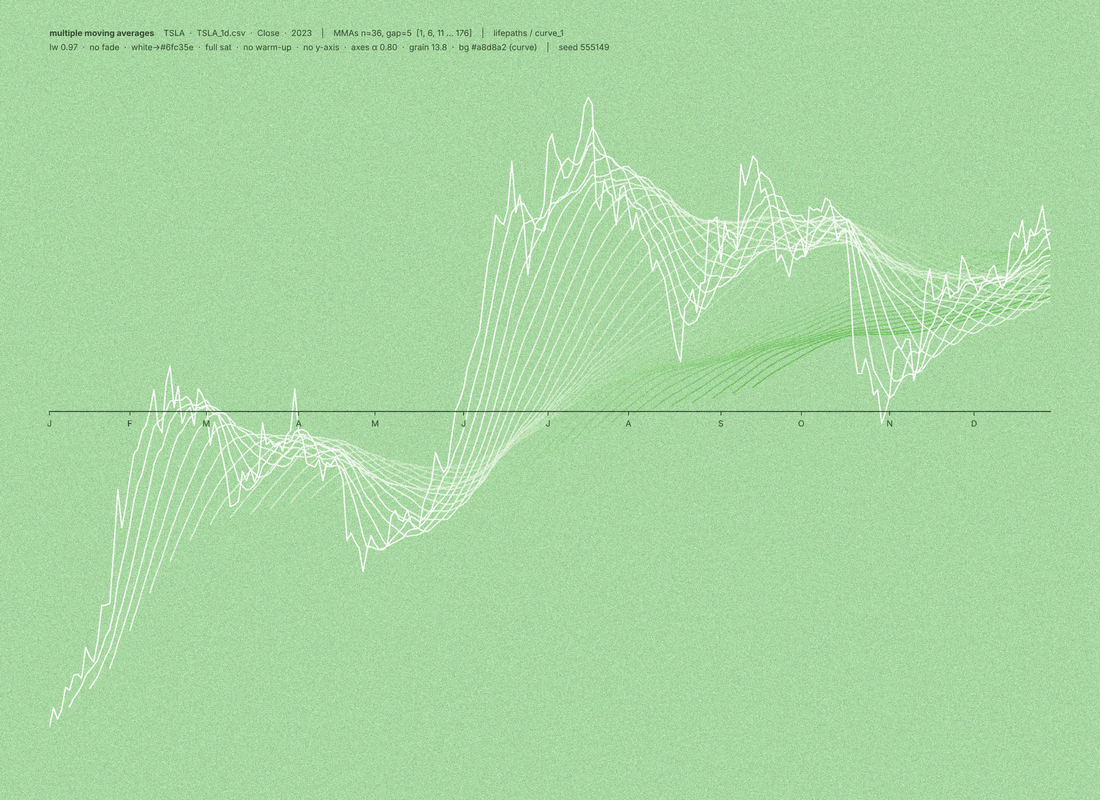
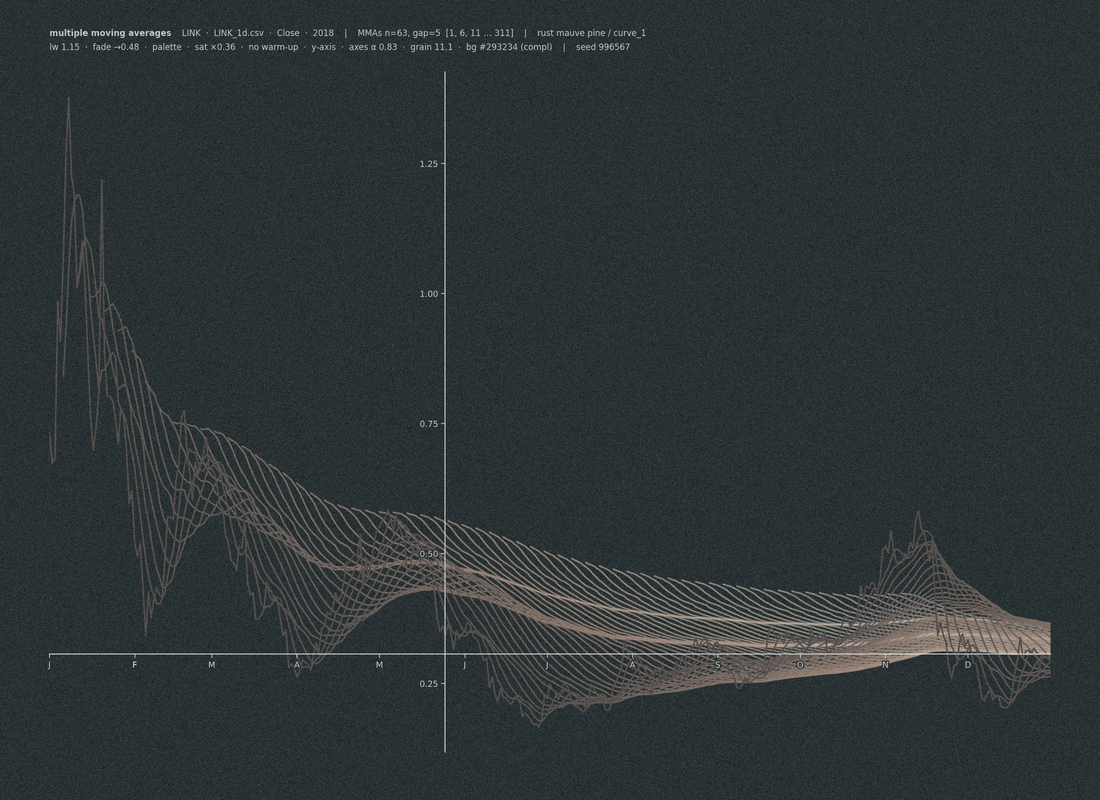
Algorithmic drawings of multiple moving averages. For fun! These are based on a random collection of time-series data, typically financial data or daily logs. The algorithm makes several randomized selections: which data, which time frame, which color palette, which parameters for the multiple moving averages (start, gap, number of lines), and a number of small formatting decisions. The chosen parameters are printed at the top. I generated a few hundred, adjusting parameter ranges as I went, and picked a few that looked interesting.