Mobile Mapping
Mapping the Unseen Qualities of Spaces
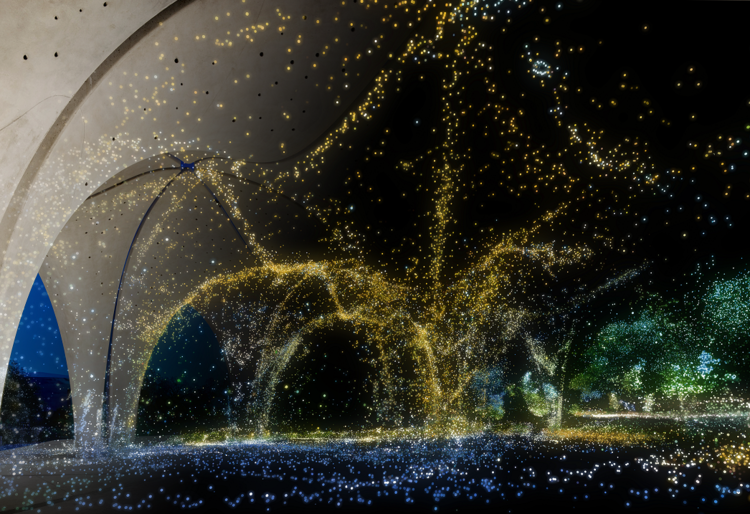
A 3D point cloud of Confluence Park in San Antonio, Texas
In 2002, the Cornell Lab of Ornithology launched an app called eBird that allows birdwatchers to record the birds they see. With the time, location, and bird species information, they can create these beautiful maps to understand the migratory patterns of birds across the country.
I want to do the same thing, but with environmental and biometric data instead of bird data.
Mobile Mapping is a workflow that creates heat maps of the unseen qualities of spaces, for example: air quality data such as carbon dioxide, temperature, and humidity, or biometric data such as an occupant’s heart rate, blood oxygen level, and neural activity. This will increase the precision and volume of data that we can collect from buildings and spaces. A mobile phone and Arduino microcontroller are used to collect data during a site visit, which is then processed in a variety of software to produce maps.
Building performance data is currently limited to anecdotes, surveys, energy monitoring, and on-site measurement with hand-held devices. By pairing data-collecting sensors with a timestamp and indoor positioning device, data can be collected efficiently, making crowd-sourced post-occupancy evaluation feasible. The data can then be visualized spatially, allowing us to evaluate the human experience of our work. In addition to this valuable design feedback loop, we can begin to quantify the value of the healthy and positive environments that we aim to provide to those who occupy our buildings.

The challenge is to collect as much data as possible from as few devices as possible. In this workflow, an Arduino micro-controller collects environmental quality data such as daylight, temperature, and heart rate, while a mobile phone records video. The video is used to detect objects and reconstruct the camera path through a process called Simultaneous Localization and Mapping, or SLAM. The data and position are then synchronized in Grasshopper to form a heat map of each metric.
The workflow is as follows:
1. Collect experiential data with a timestamp
2. Determine position with a timestamp
3. Synchronize data and position to create a map.
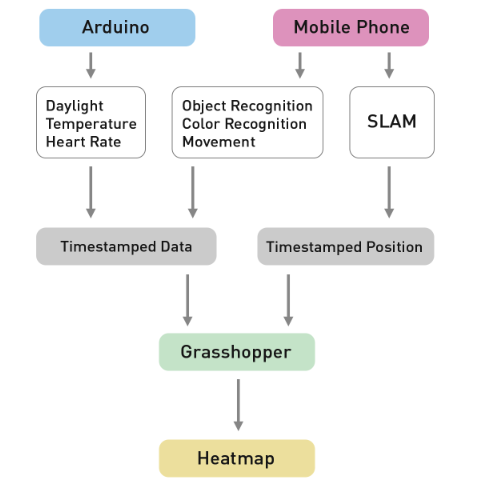
Mobile Mapping Workflow
All of the data collection is done on site with a mobile phone recording video, and an Arduino microcontroller with any combination of sensors. Timestamped data is logged from both devices, and the video frames are processed with a method called Simultaneous Localization and Mapping (SLAM) to create a 3D point cloud of the scanned space and the path of the camera moving through it. The resulting data points and corresponding position are processed in a Grasshopper script that interpolates a map of the data.
What Data Should Be Collected?
The first potential set of data to be collected is typical environmental quality data such as:
1. Daylight
2. Temperature
3. Humidity
4. Wind Speed
5. Carbon Dioxide
6. Carbon Monoxide
7. Pollutants
This project emphasizes the importance of biometric data, a realm of data that has been less frequently explored because of the historical challenges of quantifying subjective human experiences. This data set includes:
1. Heart Rate
2. Blood Oxygen
3. Body Temperature
4. Movement
5. Neural Activity
6. Stress
7. Sound
8. Color
9. Distance of Views
10. Vegetation
11. Object Recognition
Subjective data can be collected by occasional post-occupancy surveys, but the growing accuracy, availability, and affordability of biometric devices has made it possible to map formally subjective qualities with objective and accurate data. Biometric data illuminates the actual human experience of a space in a way that environmental quality data can only approximate.
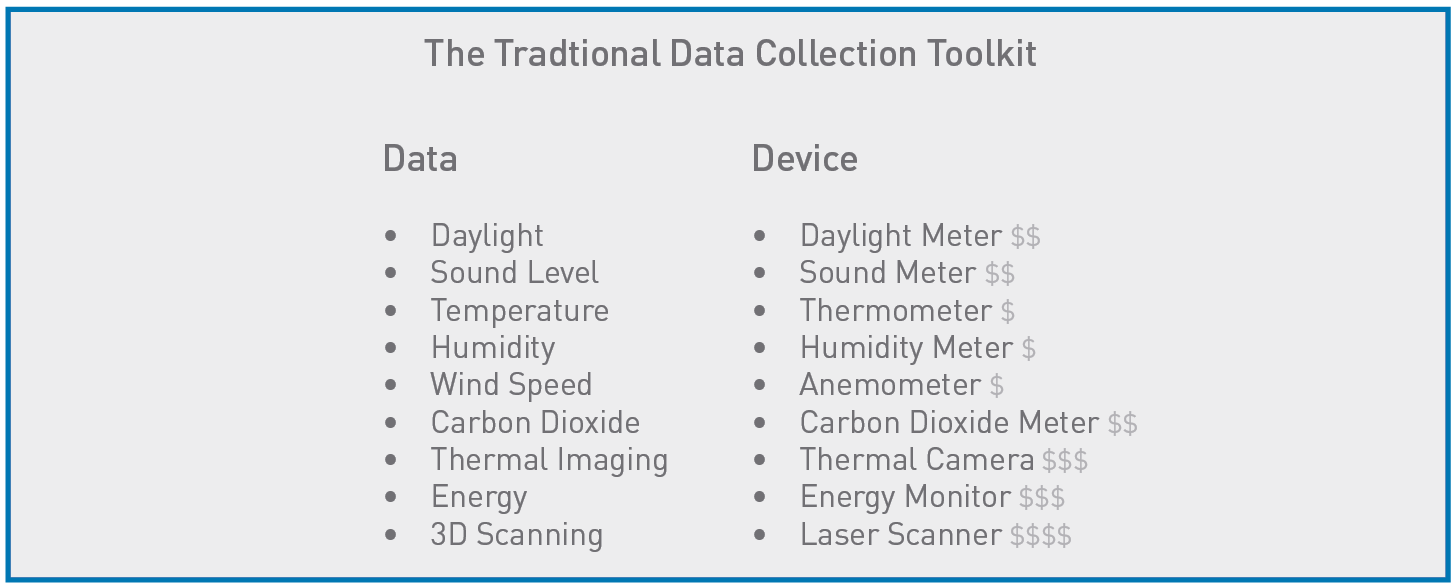
Selecting Data Recording Devices
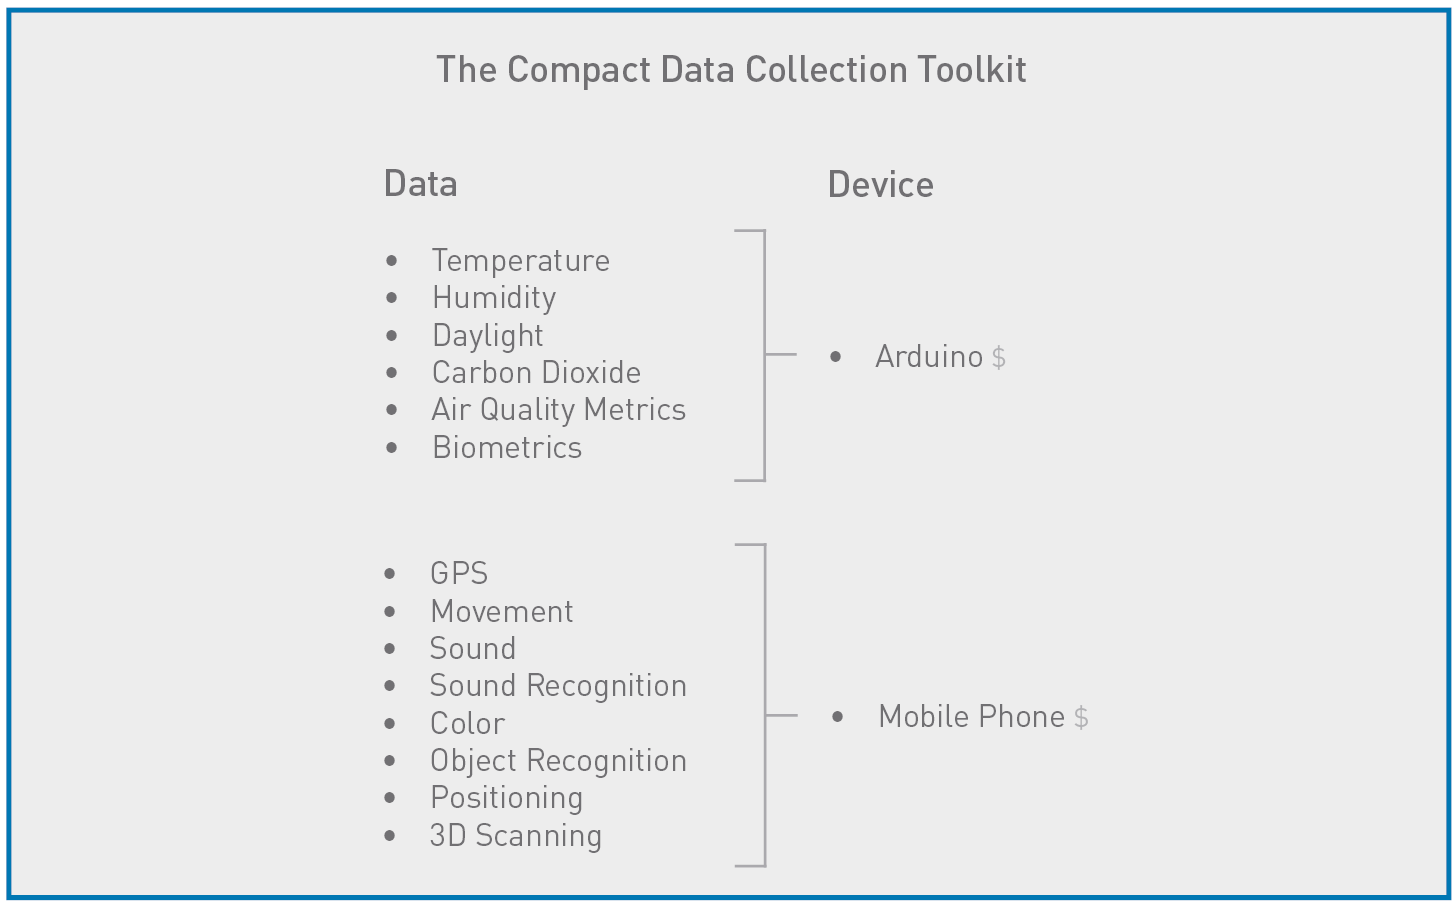
Our toolkit for collecting spatial data pre-occupancy or post-occupancy can be as robust as we want it to be, but each device comes with a price tag. We are currently limited both by cost and the amount of data we can collect. Most of the devices listed above are not always inexpensive, readily available, or discrete, and do not include a built-in geo-location and timestamp. The only way to gain valuable insights from spatial data collection is by collecting a lot of it. This requires an easy workflow with universally available devices so that data has the potential to be crowdsourced.
The objective is to get the most data with as few devices as possible. For this project, data will be collected through a combination of an Arduino microcontroller and a mobile phone. Arduino is an open source microcontroller computer that can be programmed to operate several sensors simultaneously and record the data.
A mobile phone can record video and collect data such as sound (decibel level, sound recognition), image (color, light, vegetation, face, and object recognition), movement (from the built-in gimbal and accelerometer), rough global positioning from GPS, and more precise spatial localization from computer vision techniques.
Crowdsourcing Data Collection
Crowdsourcing is the process of building a data set with input from a large group of people. It has become more feasible since widespread mobile access to the internet. These data sets can be mined and displayed graphical to reveal major trends and nuances in the data.
Applications such as Roast by Kieran Timberlake track survey responses of building occupants based on their location. Survey responses are valuable data, but are subject to intentional or unintentional deception or biases. Collecting biometrics sheds light on human response to the built environment without the subjectivity, inaccuracy, or inconvenience of manual data entry.
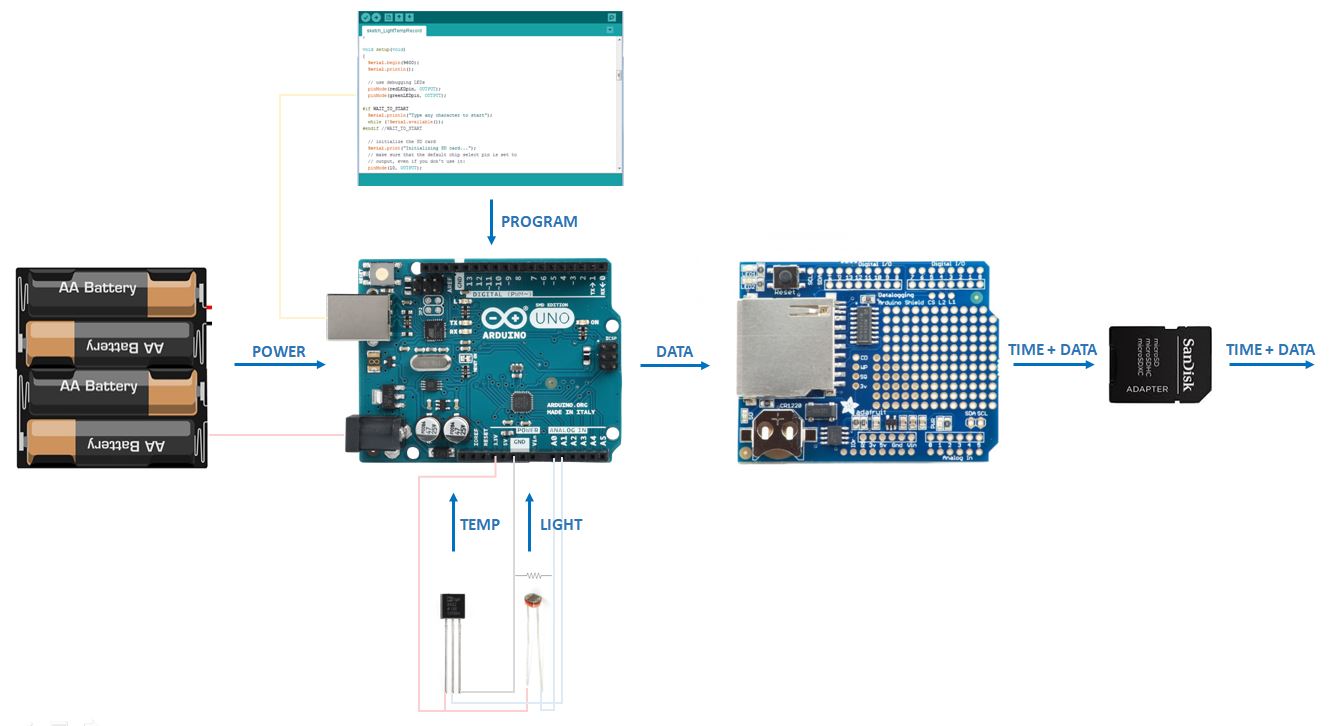
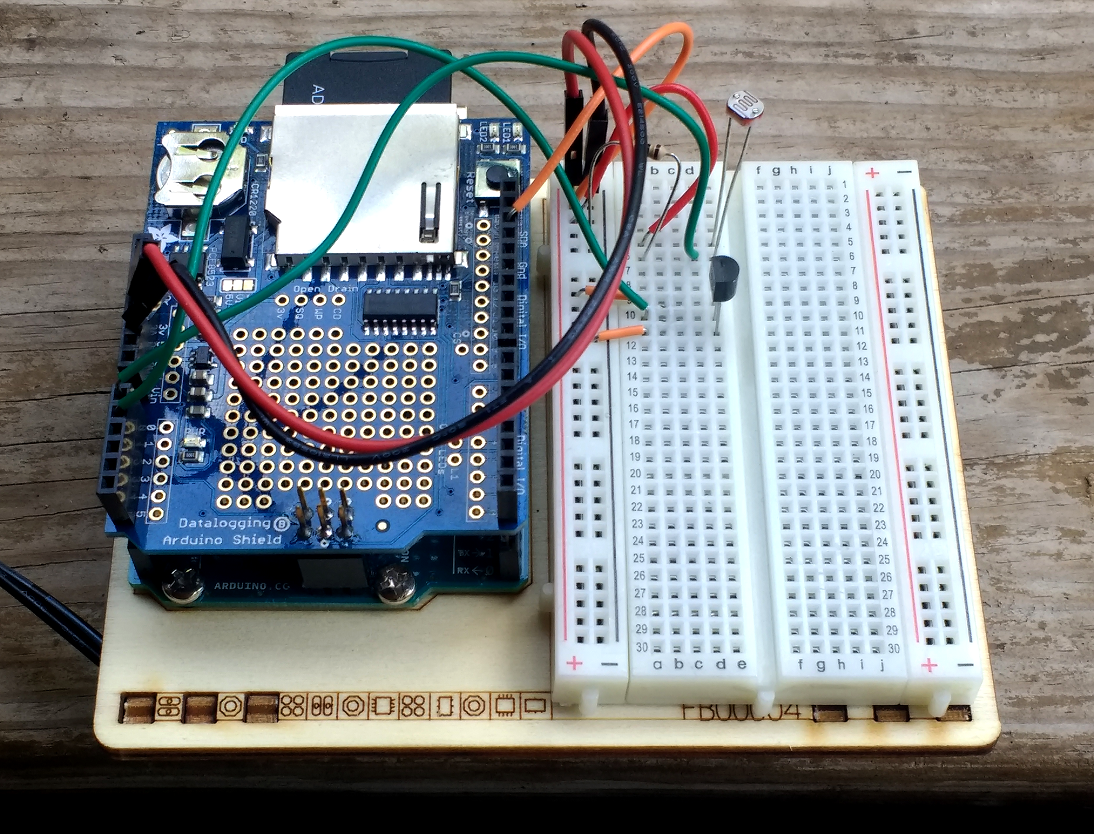
Setting Up the Arduino
The Arduino UNO is a portable micro controller powered by a small battery pack. Six AA batteries last longer than a 9-volt battery, which is also sufficient to power the system. For the first experiment, a program is uploaded to the Arduino that allows it to record light level and temperature from two sensors once every second. A data logging shield is soldered to the top that records the data to a memory card with a timestamp. The Arduino begins recording data as soon as it is plugged in to the power source.
Positioning Options
The other half of the workflow is establishing a positioning system. Six options were considered:
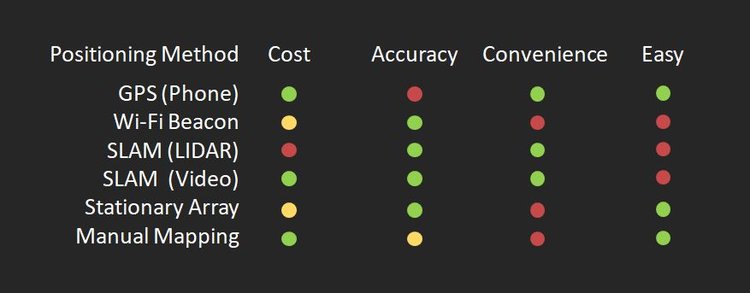
GPS is the simplest and most easily available option. Early maps were completed with GPS as the positioning system, which works well when covering large areas outdoors. A margin of error of a few meters is reasonable for mapping at an urban scale, but GPS is not accurate enough for an indoor application.

Temperature mapping at the Pearl District in San Antonio,
Indoor positioning with a WiFi signal is feasible, but it requires the placement of beacons within a space before every survey. The ideal positioning system would stand alone as its own device and not require any set up work.
SLAM is an acronym for Simultaneous Localization and Mapping. It’s a method used in robotics and autonomous vehicles in which a moving object uses sensors such as cameras, radar, or lidar (like radar, but with lasers) to map its surroundings, and then understand how it is moving relative to those surroundings. The choice between lidar versus a camera is a choice between investing more heavily in hardware versus software. Lidar requires more impressive hardware, with less work to process the data, and vice versa. Lidar is more expensive and not as universally available as video on a mobile phone, making vision-based SLAM more ideal, if not as easy.
A stationary array of data-collecting sensors bypasses active positioning altogether, though the trade-off is the investment in installation and limited area of collection. Finally, a human-powered compromise of manually marking one’s location on a printed plan or touchscreen as data is being collected and timestamped separately.
Vision-based SLAM (loosely synonymous with Structure From Motion (SfM) or Photogrammetric Range Imaging) is perhaps the most challenging option (especially without a background in robotics or computer vision), but is the most promising considering the ease and ubiquity of collecting data from a mobile phone. There is also reason to be more optimistic about upcoming advances in software versus hardware. Many open-source visual SLAM packages have become available in recent years and are likely to continue improving.
Intro to SLAM
COLMAP 3.4, a Structure from Motion software, was used to perform SLAM. COLMAP is a pipeline with a graphical interface that inputs photos and outputs a 3D point cloud and the locations of the camera in each photo. It has three major processes:
1) Each frame of the video is analyzed to determine the focal length, dimensions, and other properties of the image.
2) Unique features are identified in each frame and matched with unique features in other frames.
3) When the same unique feature appears in multiple frames, its position is triangulated and a point is created with position and color value. The reconstruction process continues, occasionally correcting for errors as the point cloud is solidified.
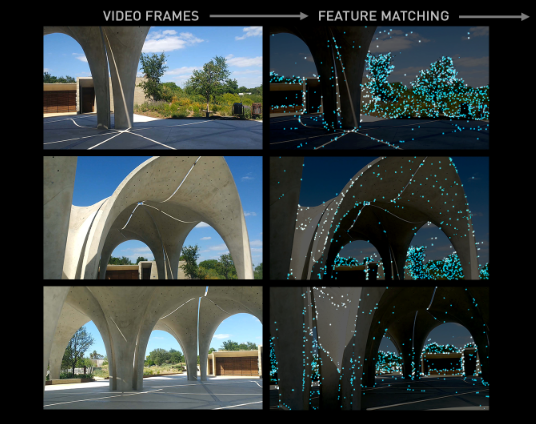
SLAM from Video Frames at Confluence Park
After turning on the Arduino, which then begins collecting light and temperature data by the second, I begin recording video and walk around the pavilion for about ten minutes. The reconstruction works best when the video frames are in focus, and the object or space is photographed from several vantage points.
The video is uploaded and processed in Photoshop to turn video into individual frames at about 4 frames per second.
a. Drag and drop video into Photoshop 2017
b. File > Export > Render Video
c. Select Photoshop Image Sequence from dropdown menu
d. Set frames per second, (probably at least 2 fps, and aim for 500-5,000 total frames)
e. > Render
This produces a few thousand individual frames that are then processed in COLMAP.
a. Open COLMAP (double click colmap.bat)
b. File > New Project.
c. Specify a name for the new database
d. Select file path to Images
e. Processing > Feature Extraction > Extract
f. Processing > Feature Matching > Run
g. Reconstruction > Begin Reconstruction
h. Save model as a .nvm file

As of now, the reconstruction in COLMAP is the most time-consuming part of the process. The following test at Confluence Park in San Antonio was a 10-minute video, with about 4,000 individual frames. It took a few hours to match unique features, and at least 24 hours for a complete reconstruction of about 300,000 points. Of course, 4,000 frames are far more than necessary to identify the path of the camera, which is all I need to construct the map of data points.
COLMAP is an incredible and generous open source program, which produced an impressive 3D point cloud and camera path, however the processing time is a bottleneck that needs to be replaced with real-time SLAM to make abundant data collection more feasible.
Interpolating the Map
When the reconstruction is done, I export the point cloud and camera path data, and process it in Grasshopper. This script synchronizes the location data with the corresponding light, temperature, and heart rate data, and produces a heat map of each metric. The remainder of the map outside of the path is interpolated with a non-linear regression model.
There were no surprises with the daylight map, ranging from about 1,000 lux in blue to about 100,000 lux in red. North is to the right on this map.
The temperature map produced a nice gradient from about 90 degrees on the sunlit, paved north side, to about 80 degrees on the vegetated south side.
My heart rate fluctuated between 70 and 90 bpm over the 10-minute survey time.
While biometrics are compelling data to be collected and mapped, they are also the most variable. While certain metrics such as illuminance and temperature are meaningful in a small sample size, biometrics such as heart rate require a much larger statistical sample before any inferences can be made.
At this point, these maps are a proof of concept of the workflow, and not yet meaningful data about the correlation between an occupant’s physical response and the environmental quality of the spacce they are in.
Object Recognition
Each video frame is uploaded to Google Photos to create a list of object tags present in the frame. They are then mapped onto the location where the video frame was captured. This adds another layer of qualitative mapping to the space.

Image recognition through machine learning provides a spatial understanding to the designer that is in some way obvious, but never codified. Converting the subjective experience of recognition into real data allows for the comparison of different spaces, and the potential to identify correlations between the objects present and the biometric experience of the space.
Object Recognition mapping at the Witte Museum front lawn, San Antonio.
Next Steps
My next steps are to streamline the SLAM workflow to get it as close to real-time processing as possible. Volume of data is critical for this kind of work, so it needs to be processed quickly and easily.
I might expand the types of biometrics being collected, for example galvanic skin response devices to approximate stress levels. There is also a lot of data to be mined from the video itself, such as color, sound, and object recognition.
Other improvements include recording video with a 360-degree camera for more efficient mapping, or viewing the model and map in VR.