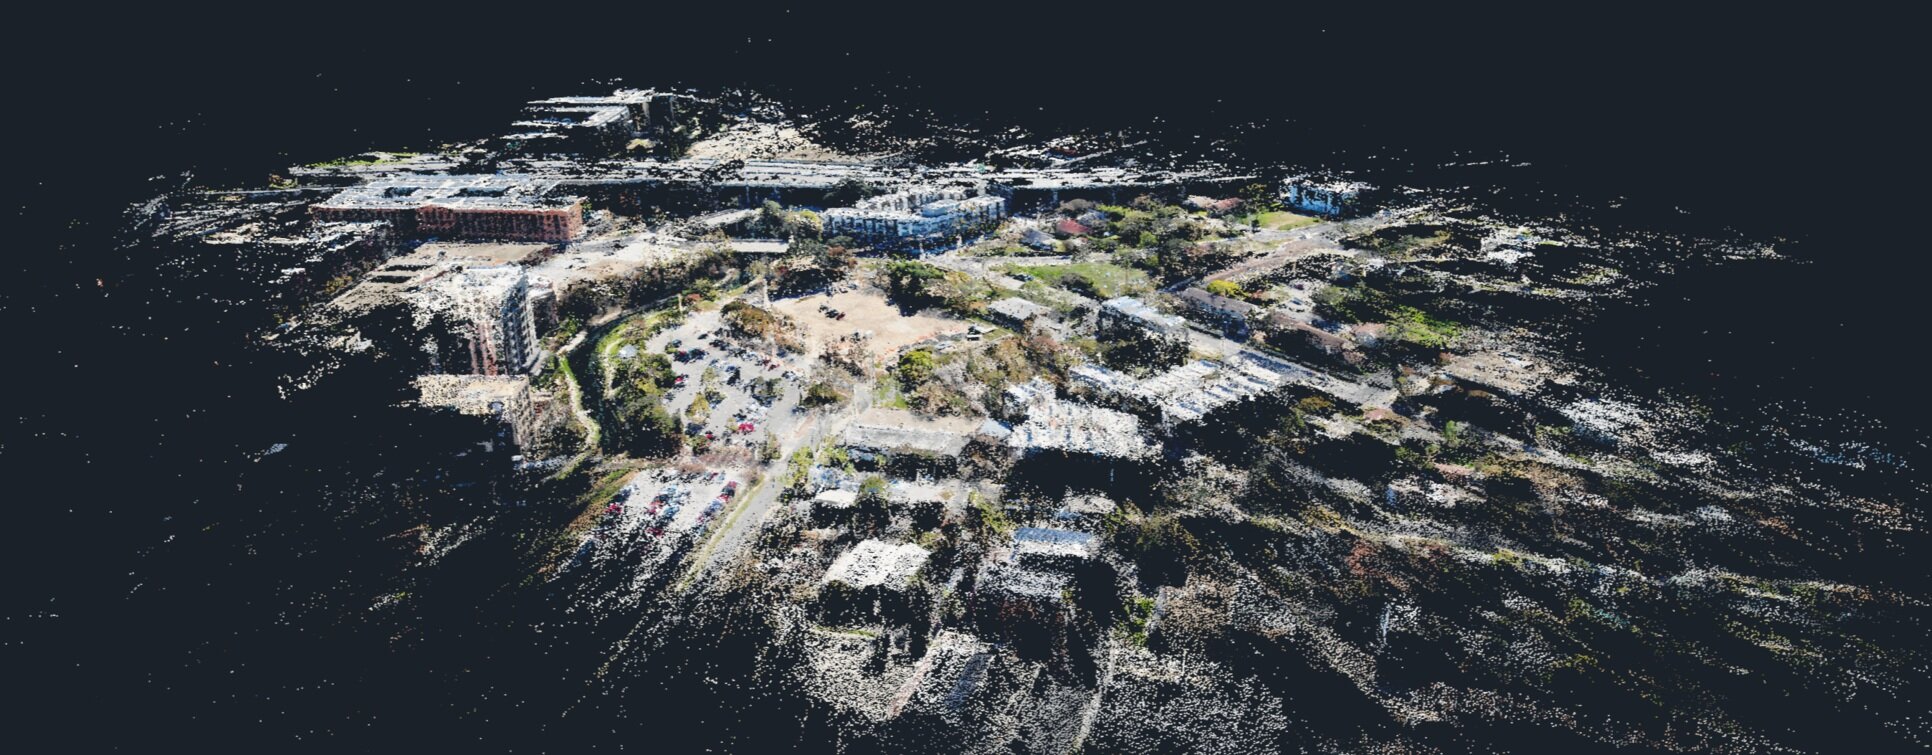
This is a two-part experiment in generative design. In part one, a site is scanned with drone photography and converted into a digital model. In part two, this embedded site data will be used to evaluate the success of several building design options generated with a parametric model. First, a drone photographs a vacant site from several different angles. COLMAP, a photogrammetry software is used to construct a 3D point cloud from the photos (pictured here). After importing the point cloud into Rhino, each point is classified into one of a few categories based on its color and position. These categories include, roads, buildings, vegetation. This creates a data-rich digital environment that will be used later.
GENERATING A FOOTPRINT
After data-mining the site, several different building footprint options are generated. Each is a different variation of the same parametric Grasshopper script. Each of these footprints are composed of 3 overlapping rectangles, and one subtractive rectangle. This is a relatively simple script that manipulates 16 variables to produce a wide range of options. In this system of data-driven idea generation, the architects role is to write the parameters that effect the family of design options, rather than to design static, bespoke options.
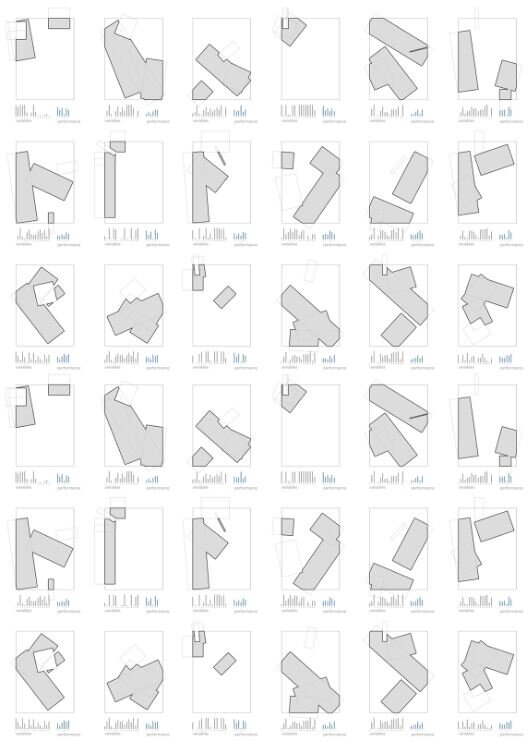
EVALUATING THE FOOTPRINT The next step is to create a process for evaluating the performance of the building footprints that are generated. This part of the process is a set of Grasshopper scripts that take a given building footprint and evaluate it in the following areas: space-making, building area, perimeter to area ratio, solar orientation, access to roads and pathways, quality of views, and obstacle avoidance/topography. Each performance test is done with different algorithms that run simultaneously. For example, the building footprint is evaluated for space-making by creating a grid of test points within a certain radius of the building, calculating the isovist (field of view) of each point, and averaging the results for all points. The footprints that have the highest average of enclosed space receive the highest space-making score.
OPTIMIZATION ALGORITHMS
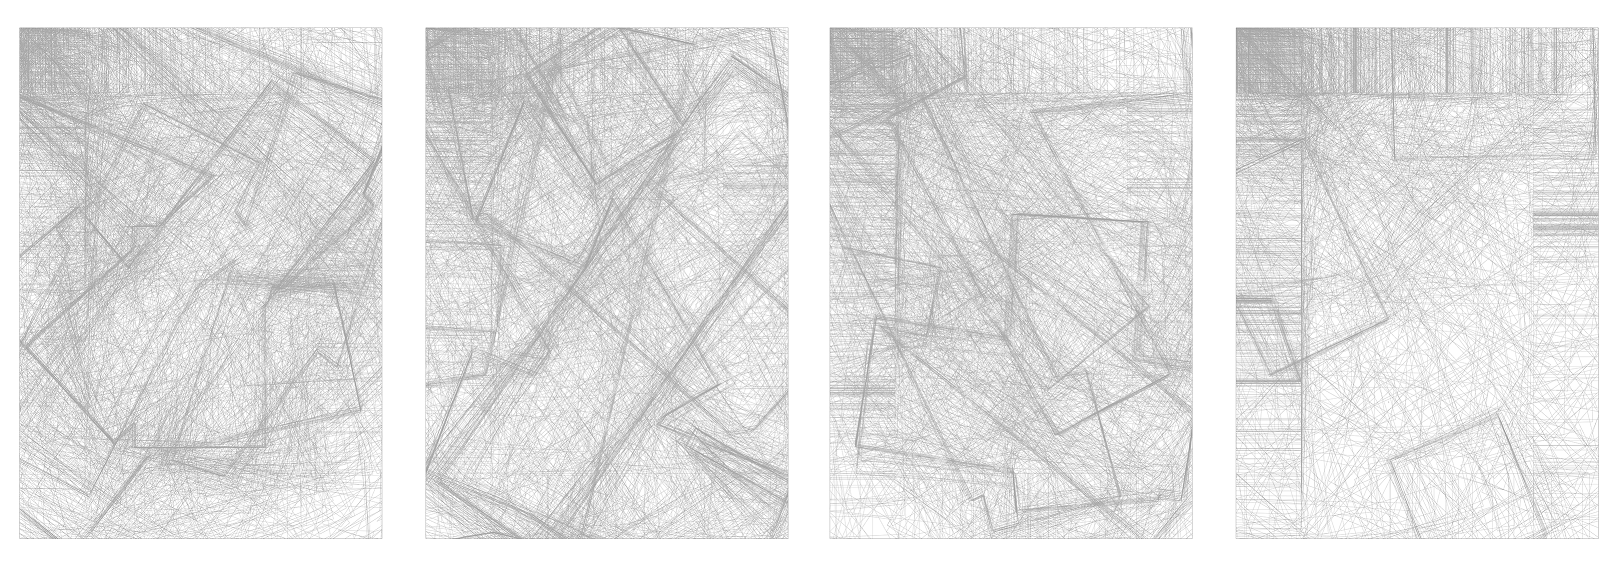
At this point, the design problem has been set up with two critical pieces; numerical design parameters that describe the design, and numerical performance criteria that evaluate the success of each design. A benefit of this method is that the designer can use an optimization algorithm to take full advantage of the computer’s strengths. An optimization algorithm is a cyclical process that tests several solutions until an optimum solution is found. Typically, the first few solutions are selected at random, and the algorithm begins to rationalize why certain sets of parameters performed better than others. After several cycles, the algorithm constructs a predictive model, or a fitness function, of how successful all solutions are across a range of variables. There are several types of optimization algorithms, each with their own strengths. In this case, I used RBFMOpt, and algorithm available in the Opossum, a plug-in for Grasshopper. RBFMOpt excels at arriving at good results with as few iterations as possible. The optimization algorithm is stopped when enough satisfactory options are available, or as long as the designer is willing to wait. In this example, a few hundred options were generated in a few minutes. When the algorithm is done, it logs a record of all results, which includes a list of parameters and a list of performance results.